Memory and debugging in Go
Context
Computer science is one of the study fields of which entry level is relatively easier due to our developed need for computers in our daily lives, ranging from PCs, tablets, notebooks, smartphones, and IoT devices. I mean, literally anyone can hop in a computer and start messing around with it.
One of the proofs that we have about that is the growing tendency of folks becoming software developers. It’s no doubt that people are becoming more literate with technology.
However, I’d like to tackle a problem that has no basis in scientific observation, but rather, an observation that I had while visiting to forums and interacting with individuals.
SOME software developers either have a knowledge gap in computing’s fundamental lore (knowledge), or rather, they’d know but still fail to relate the lore with the problems that we have.
This is by no means a derrogatory observation. It’s not people’s fault in failing to relate with the said lore, but rather, it’s the computer science’s nature in being a nebulous realm:
We have some concepts that are tangible enough for non-academic people to learn and use it. We can list high level programming languages, algorithms, data structures, frameworks, and so on. The consensus is that tools and frameworks are easier to grasp.
We have some other concepts that non-academic folks cannot relate that well because they’re too specific. They’re used in either complex and demanding systems, or systems that were subject of academic/corporate research and became a product. They usually rely on concepts like Operating Systems, Computer Architecture, Distributed Systems, and the list goes on.
Complexity
And I once had this thought: there are a few companies that really need to rely on these specific set of knowledge, and the great 95% of the companies that happens to develop a software solution hardly has problems that need complex solutions to be addressed.
However, in these 6 years that I work with software development, I faced inumerous situations that contradict the above’s statement.
The truth, anecdotally speaking, is that any project that has the potential to scale in usage or demands will eventually face an issue within these complex realms. New users hop in, and with them: a new set of needs and demands, another set of requirements appear. Not only we need to accommodate new users, but we want to keep the old ones too.
With the number of users increasing up to a point, old tricks won’t work. With more
data, maybe that monolithic database won’t cut it. With more access, that monolithic
HTTP server won’t handle extremely large number of requests. And with bigger queries,
that O(n) for-loop that finishes in 10 seconds will violate the 3 second SLA agreement,
and now the company’s budget is in jeopardy.
With that said, and knowing the background of how we’re getting more self-taught developers out there, I conclude that the context in which computing is being presented to others is not practical and not relatable. Thus, bringing more folks with fundamental knowledge can help speed things up and these “complex systems” will more likely to be well maintained.
In this How-To, I want to briefly explain different concepts of memory usage
in general, and how it’s applied in Go programming. Afterwards, I’ll explain how
to debug memory usage for a Go program.
What is memory?

Memory is an information storage component in a computer system. It can be both a standalone component (such as a hard-drive device, solid state device, random access memory/RAM…) or embedded within other components such as the CPU (L1 to L4 caches) or in GPUs.
It can be also classified by its volatile property, which refers to the capability of the component to store data while powered by electricity or not.
The volatile memory is one that’s only capable of storing data while being powered by electricity, so once the computer is unplugged, the device loses all of its data, whereas a non-volatile may hold the data permanently, disregarding power.
From the software perspective, we refer it as Physical Memory.
In the beginning of times, even before the initial UNIX timestamp (lol), folks
would interact with physical memory in a direct manner using assembly language,
which is known as asm.
Just to give you an example, the first asm code ever seen in the wild dates
from 1947 in Coding for A.R.C.. by Kathleen and Andrew Booth, whose
predecessor was, well, machine code (binary).
Behold the lovely snippet for a hello world program in x86 Linux-compartible asm:
;Copyright (c) 1999 Konstantin Boldyshev <konst@linuxassembly.org>
;
;"hello, world" in assembly language for Linux
;
;to build an executable:
;       nasm -f elf hello.asm
;       ld -s -o hello hello.o

section .text
; Export the entry point to the ELF linker or loader.  The conventional
; entry point is "_start". Use "ld -e foo" to override the default.
    global _start

section .data
msg db  'Hello, world!',0xa ;our dear string
len equ $ - msg         ;length of our dear string

section .text

; linker puts the entry point here:
_start:

; Write the string to stdout:

    mov edx,len ;message length
    mov ecx,msg ;message to write
    mov ebx,1   ;file descriptor (stdout)
    mov eax,4   ;system call number (sys_write)
    int 0x80    ;call kernel

; Exit via the kernel:

    mov ebx,0   ;process' exit code
    mov eax,1   ;system call number (sys_exit)
    int 0x80    ;call kernel - this interrupt won't return
When we didn’t have complex operating systems, all computers were mainframes. Programs were designed so that you’re directly interacting with all system components such as the CPU, memory, devices, and anything that can be within its reach.
But then, another problem arose: every time someone invented a new CPU architecture, you needed to learn everything from scratch from the perspective of the assembler language: operations, registers, instructions, everything.
Not only that, but computers in general were becoming more and more powerful, and a need to keep track of their usage surfaced, along with more and more needs from companies and engineers. So for once, single-task computing went to multi-task computing.
You can imagine that, at the time, you could run one program at a given time. Just think about it for a second.
So then, folks started to create more complex functionalities in the operating systems to establish some abstractions to make programming friendly and more productive, so that programmers wouldn’t crash computers because they were trying to poke the memory with a stick over a distance.

How memory works
Getting its history out of the way, let’s understand some fundamental pieces of how memory works.
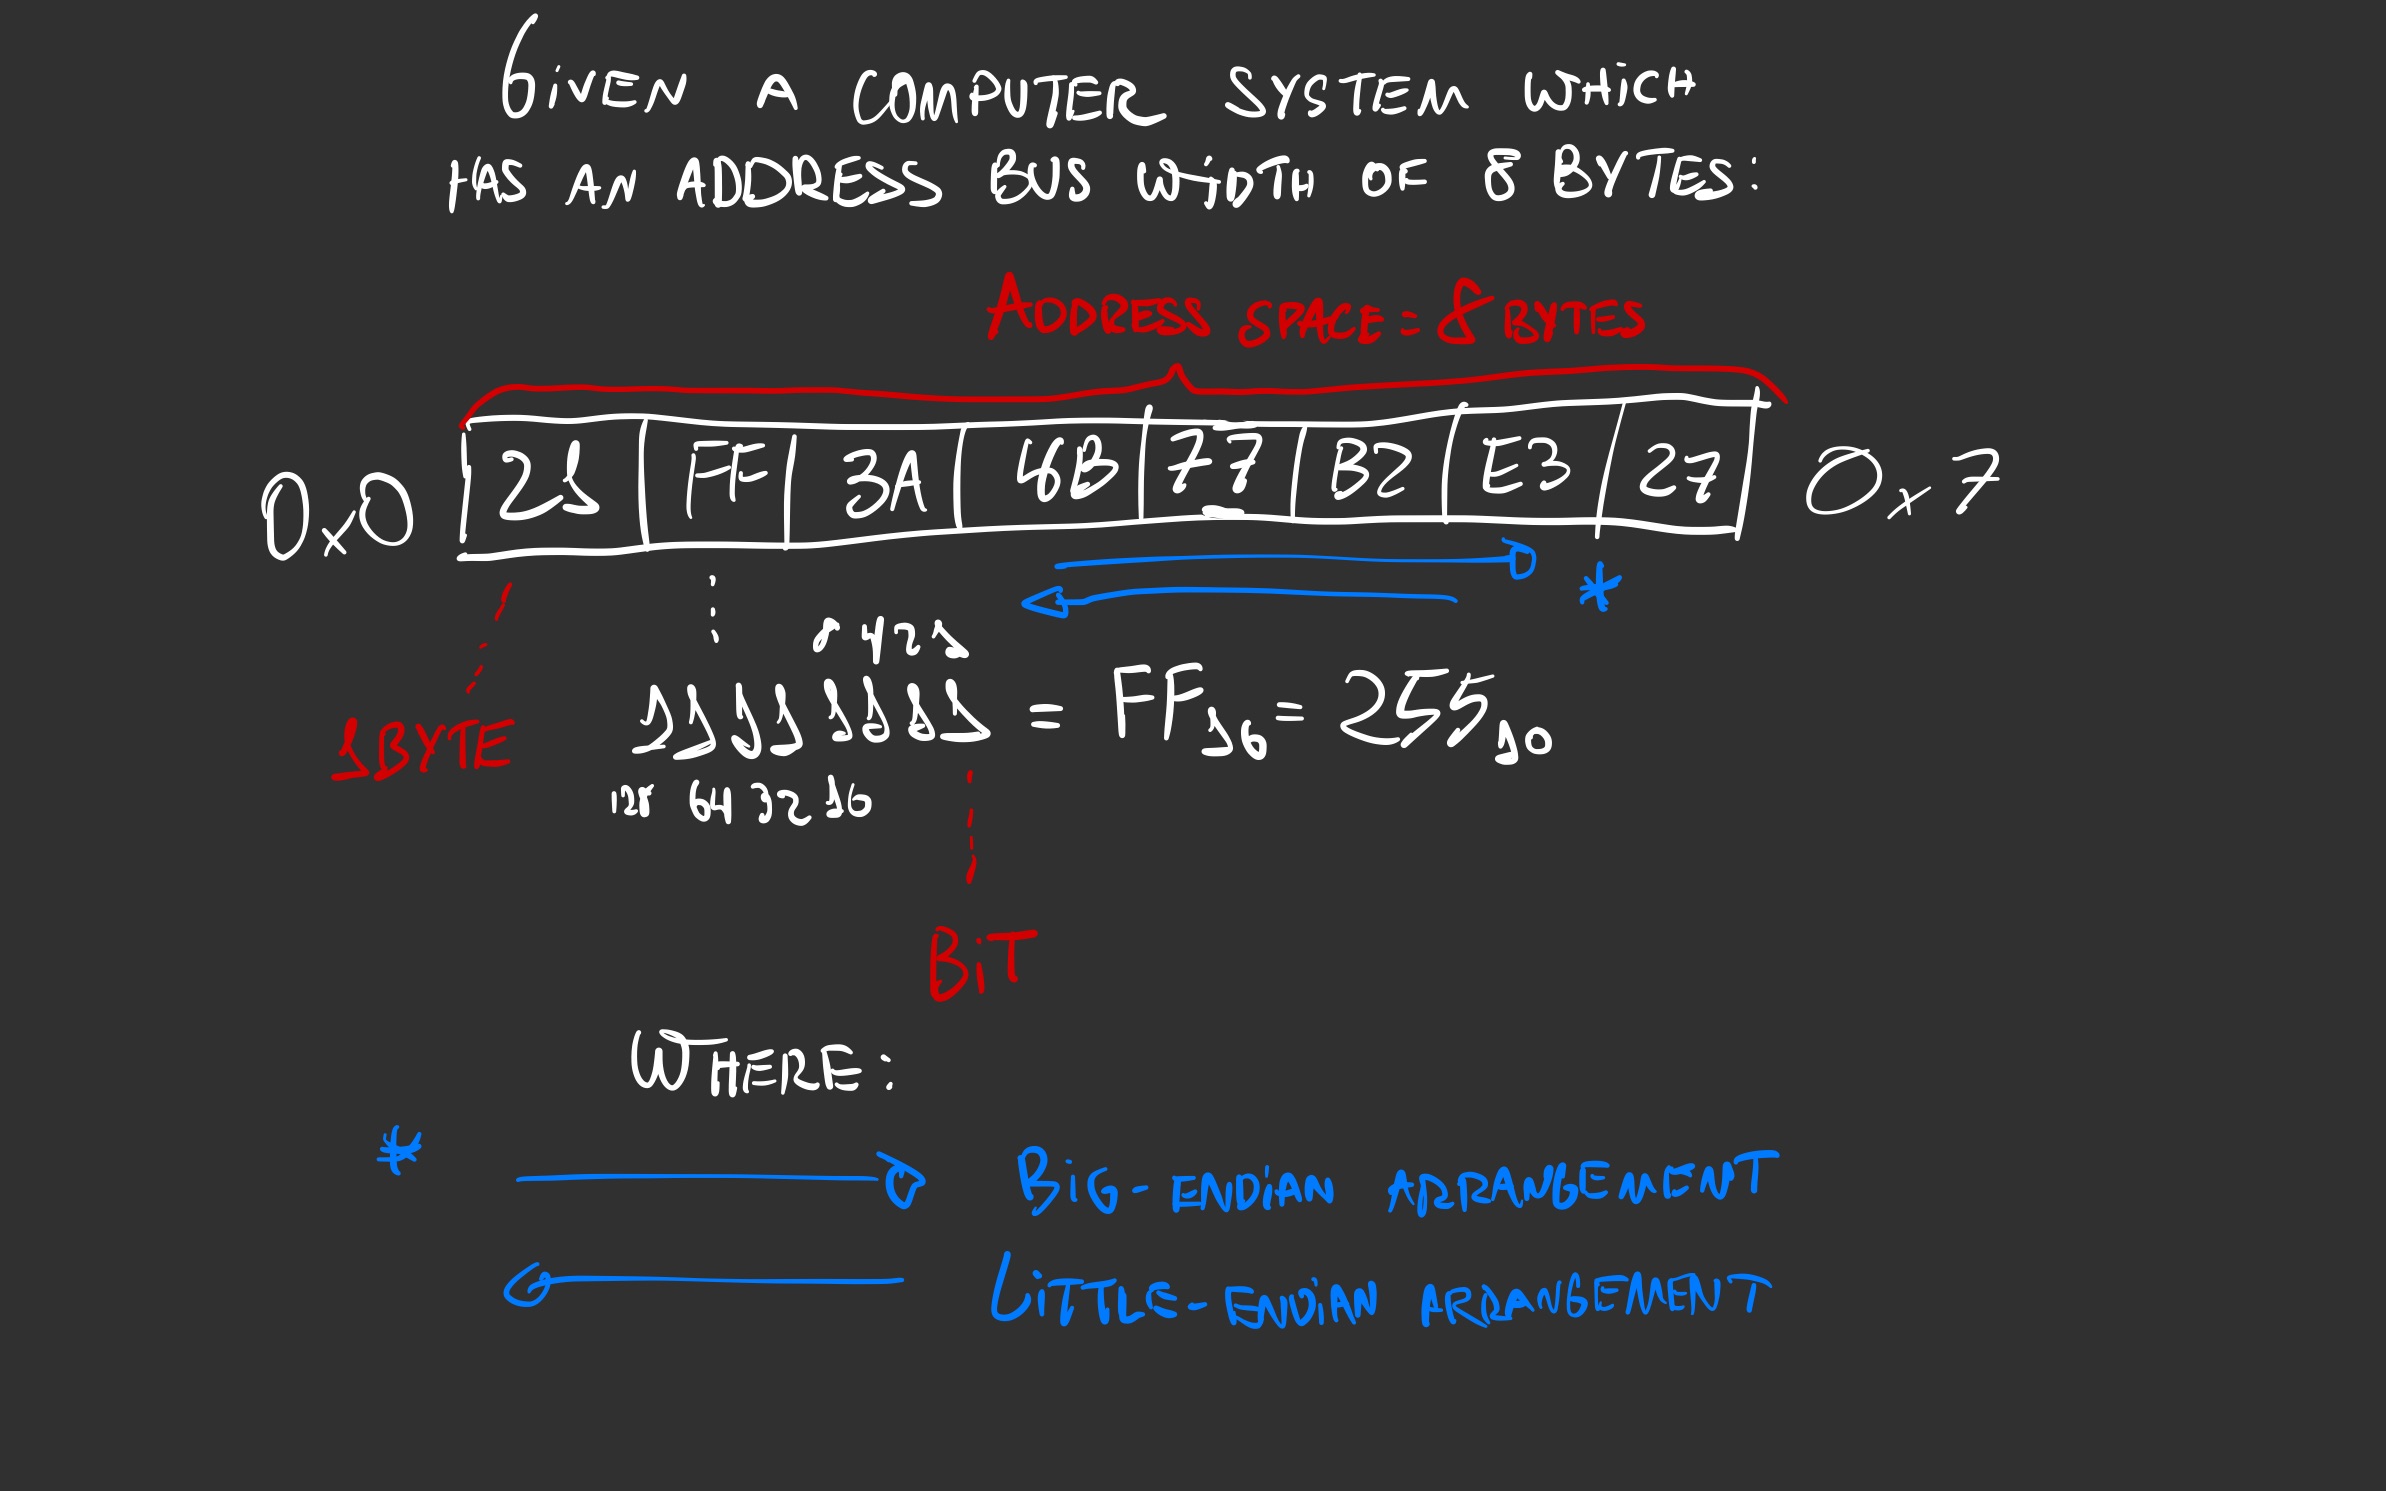
Abstractly speaking, a memory is a sequence of spaces that can hold data. Each memory space holds a byte, which is eight bits. A full memory address can hold up to a word, which may be four or eight bytes (32 or 64 bits) depending on the address bus width, which may be four or eight bytes.
Let’s zoom out further and further.
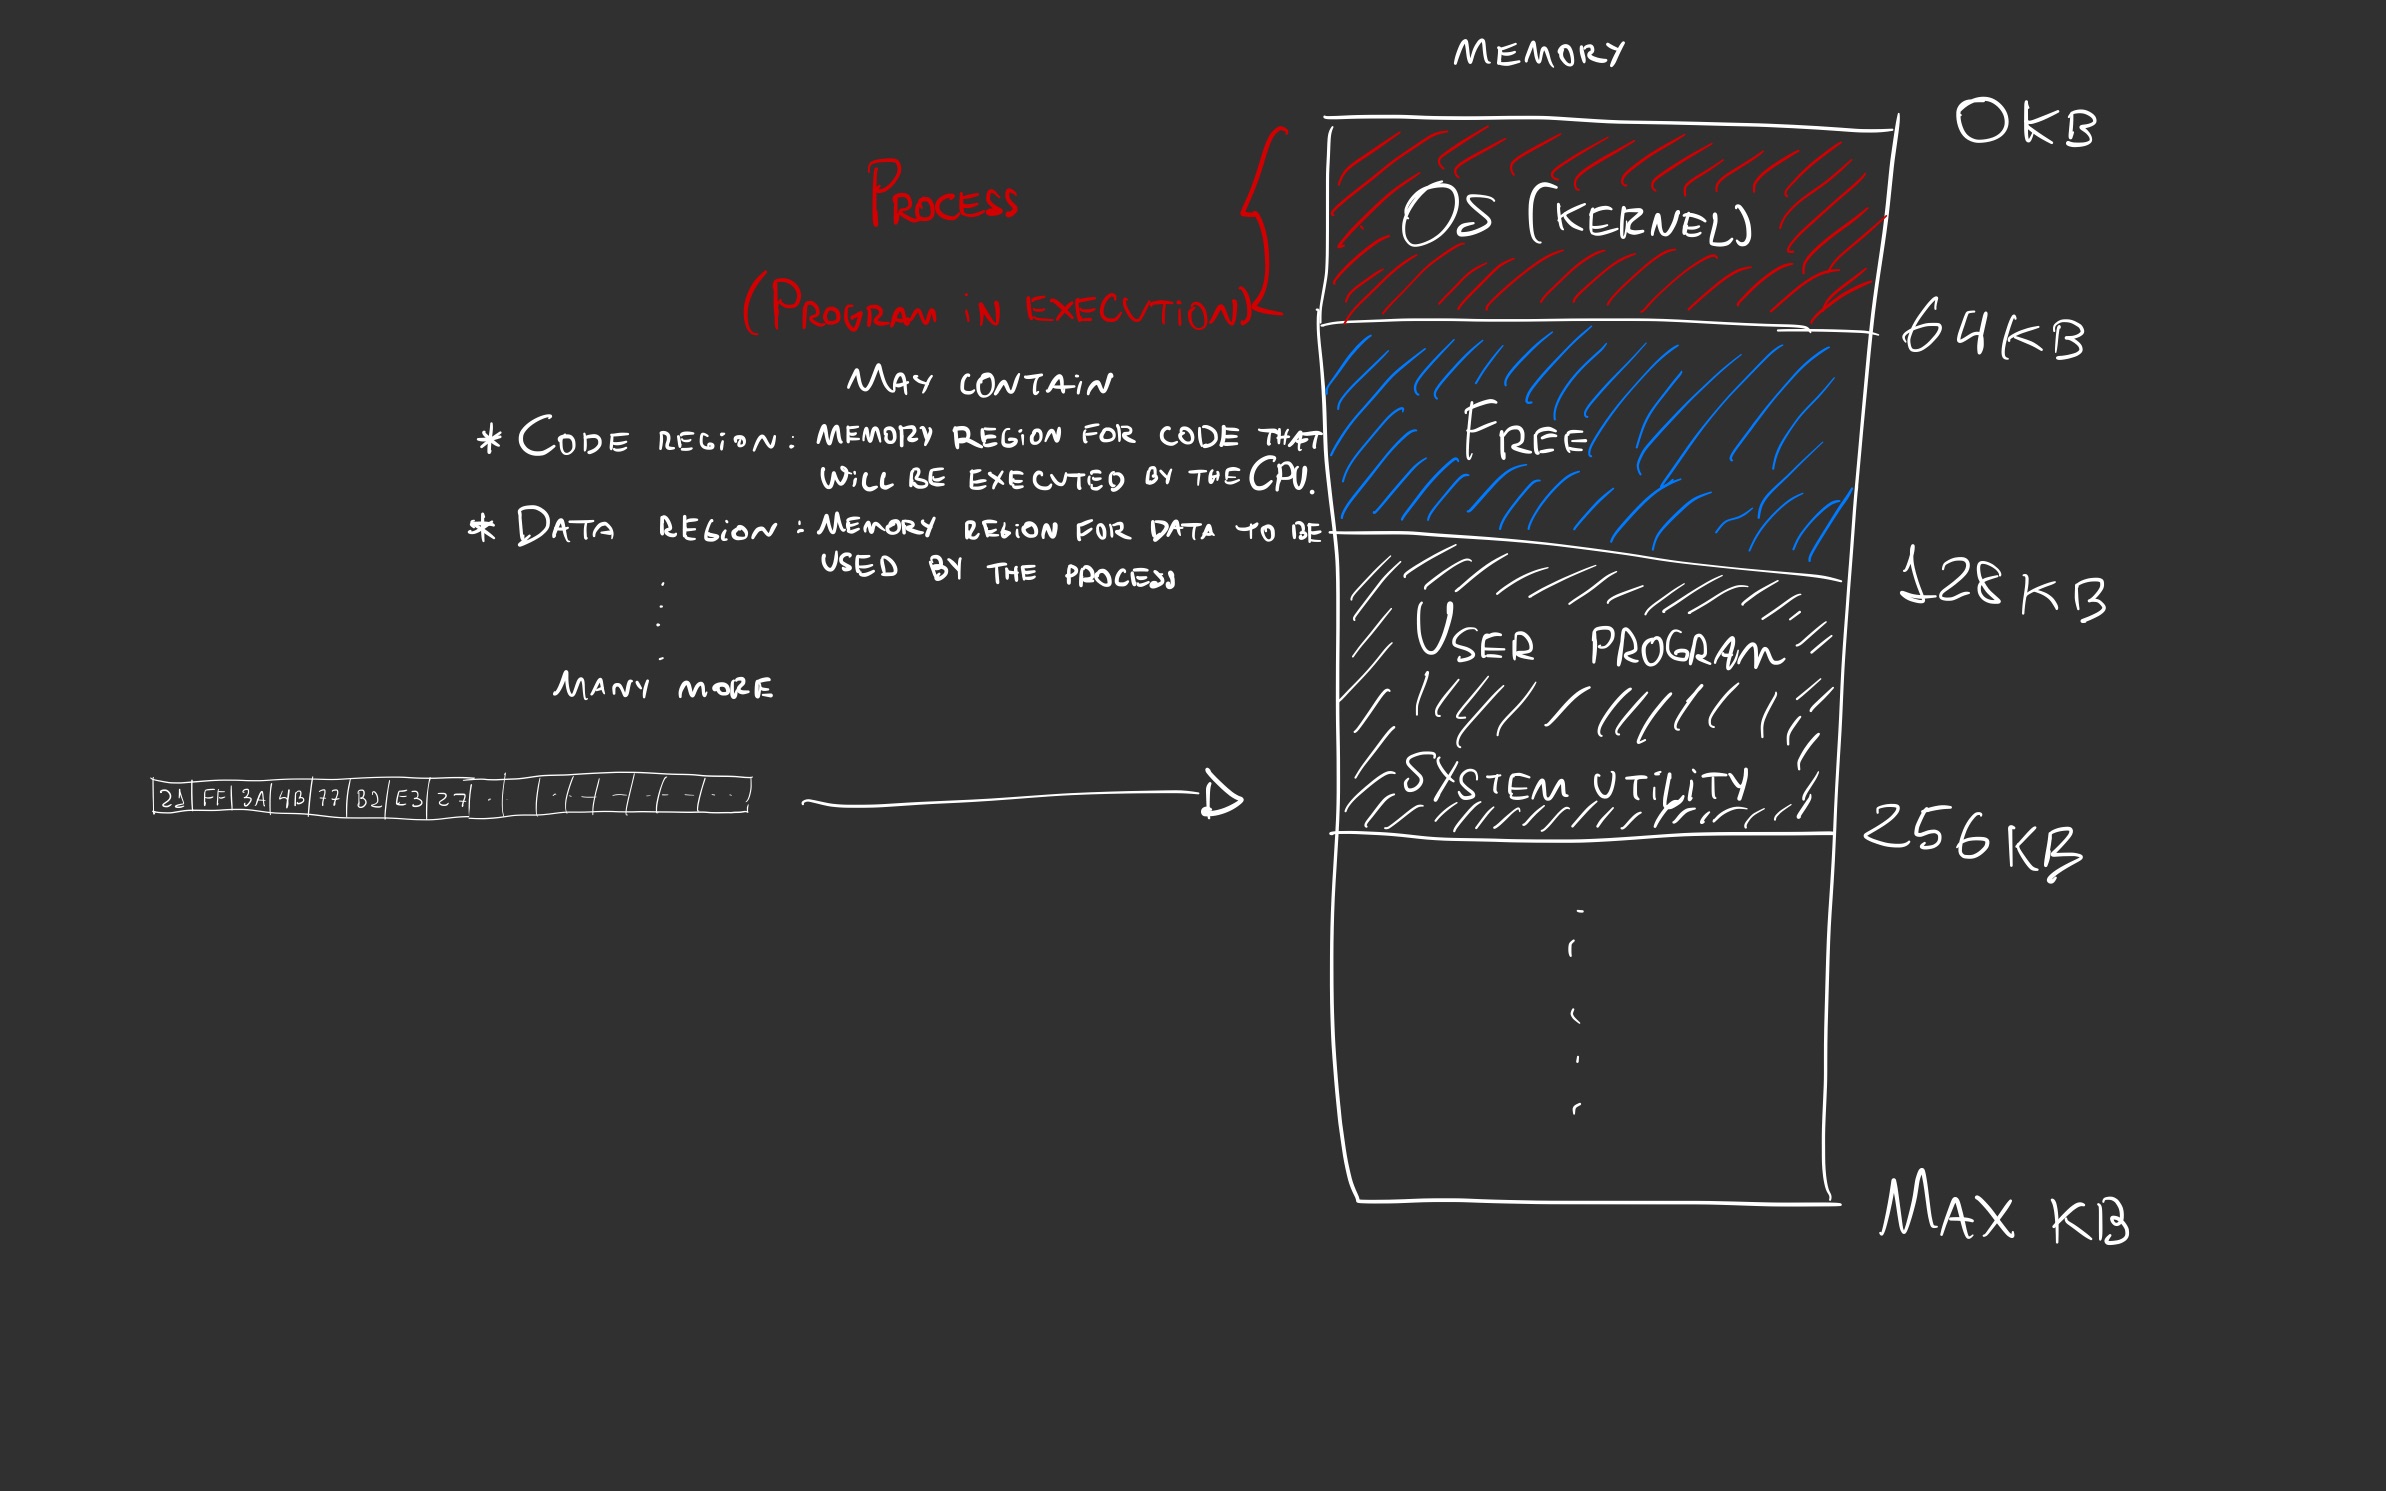
Given that engineers wanted to run more programs at a given time, it was required that multiple programs could use the same memory space without colliding with each other. Thus, it was required to be easier to use and manage.
So this is how virtualization came to be for us to interact with it in an easier manner, which consists of picking a physical model of a component into a virtual one, like Virtual memory, a memory management technique to give the user an illusion for exclusive use of memory.
When a program is executed, it’s then called a process, which occupies space in memory for its execution, otherwise, the CPU wouldn’t be able to fetch its instructions.
Inside the memory region it occupies, its code, data, and everything that’s required to function are within. All programs fall under the line, even operating systems.
In the beginning of times, only a single program could execute at a given time, and they’d occupy the whole memory space along with the OS.
Let’s use this as an example as we won’t be dealing with multi-tasking at this point as it’s going to introduce unnecessary complexity:
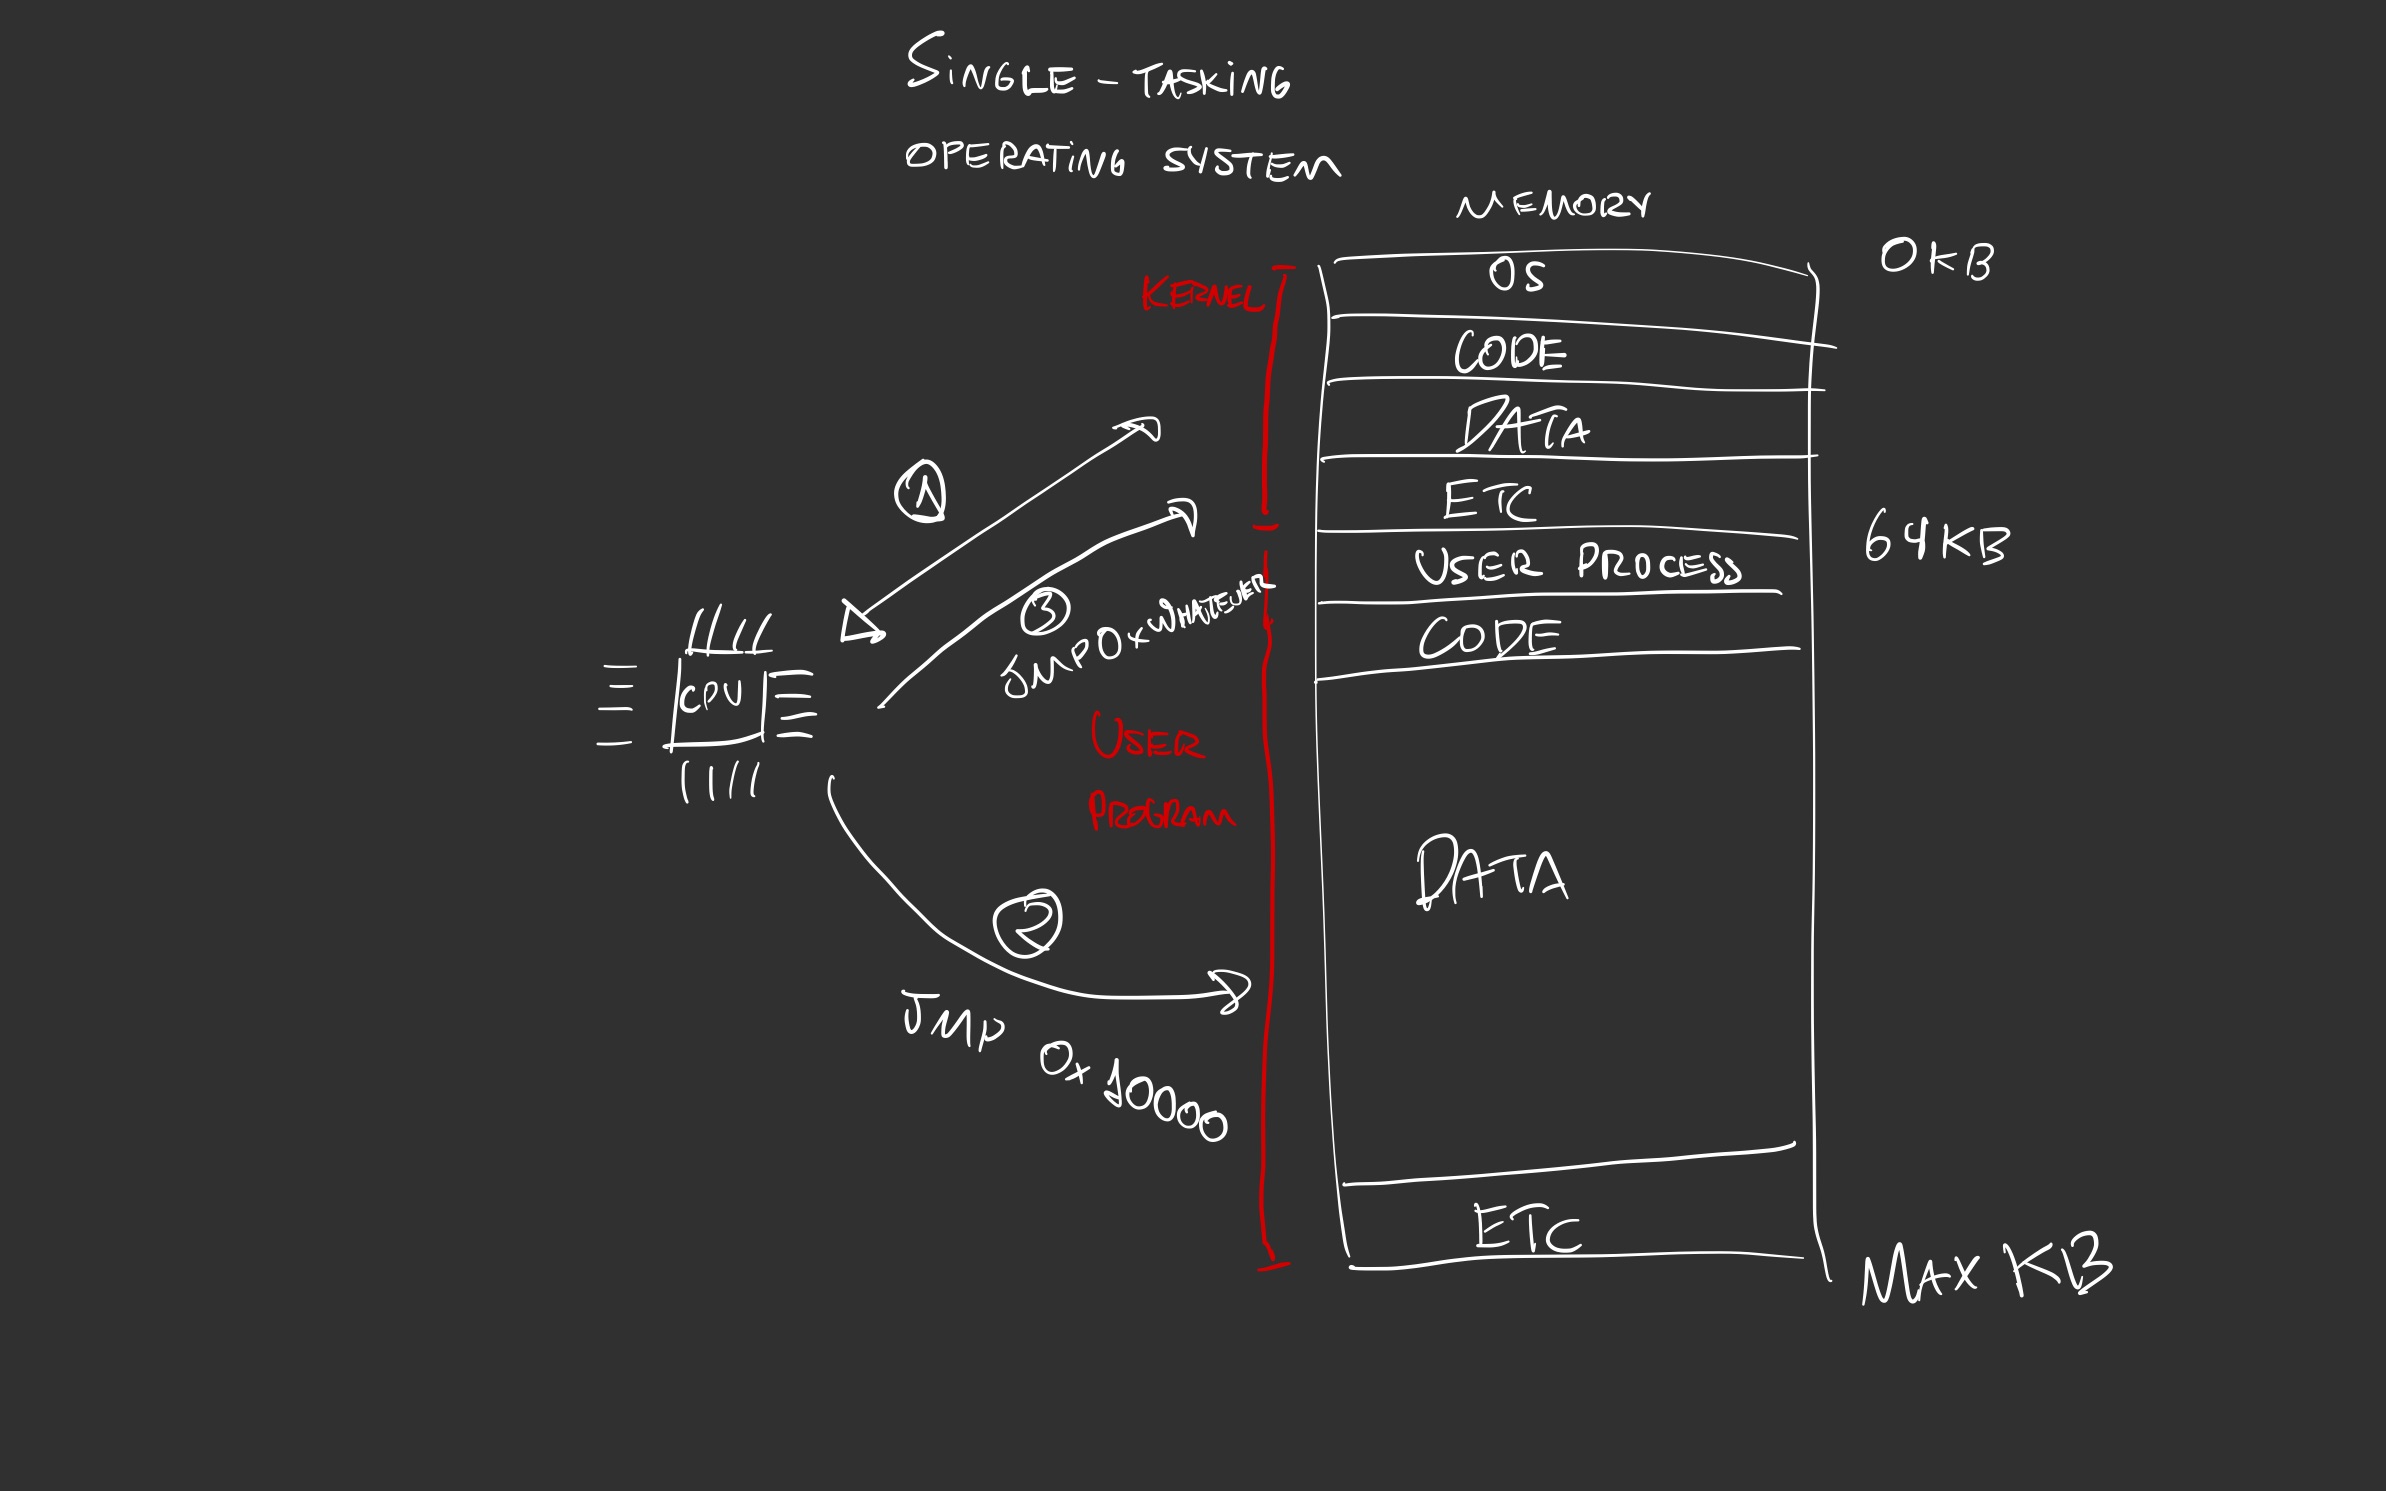
In this basic model:
The operating system takes hold of the CPU execution, it doesn’t share it with any other program, it basically executes its own program, nothing else;
If the computer wants to execute another program, the OS (via its kernel) must transfer the code execution to the entry point of the other program. Usually, from the filesystem, the program is loaded to the memory by the kernel, and then the OS would commence the execution. In
asm, you would do that with the commandjmp <address>, in whichaddressis where the code entry point is located1;Whenever the user program is done executing, it gives the control back to the kernel using the same principle:
jmp <address>. In x86 processors, where there’s multi-tasking, an interrupt 0x80 is used to signal the CPU to give the execution flow back to the caller, which is the kernel (I love abstractions so much).
Given the user program was written in C programming language in Linux with x86 arch2, it has the following memory model:
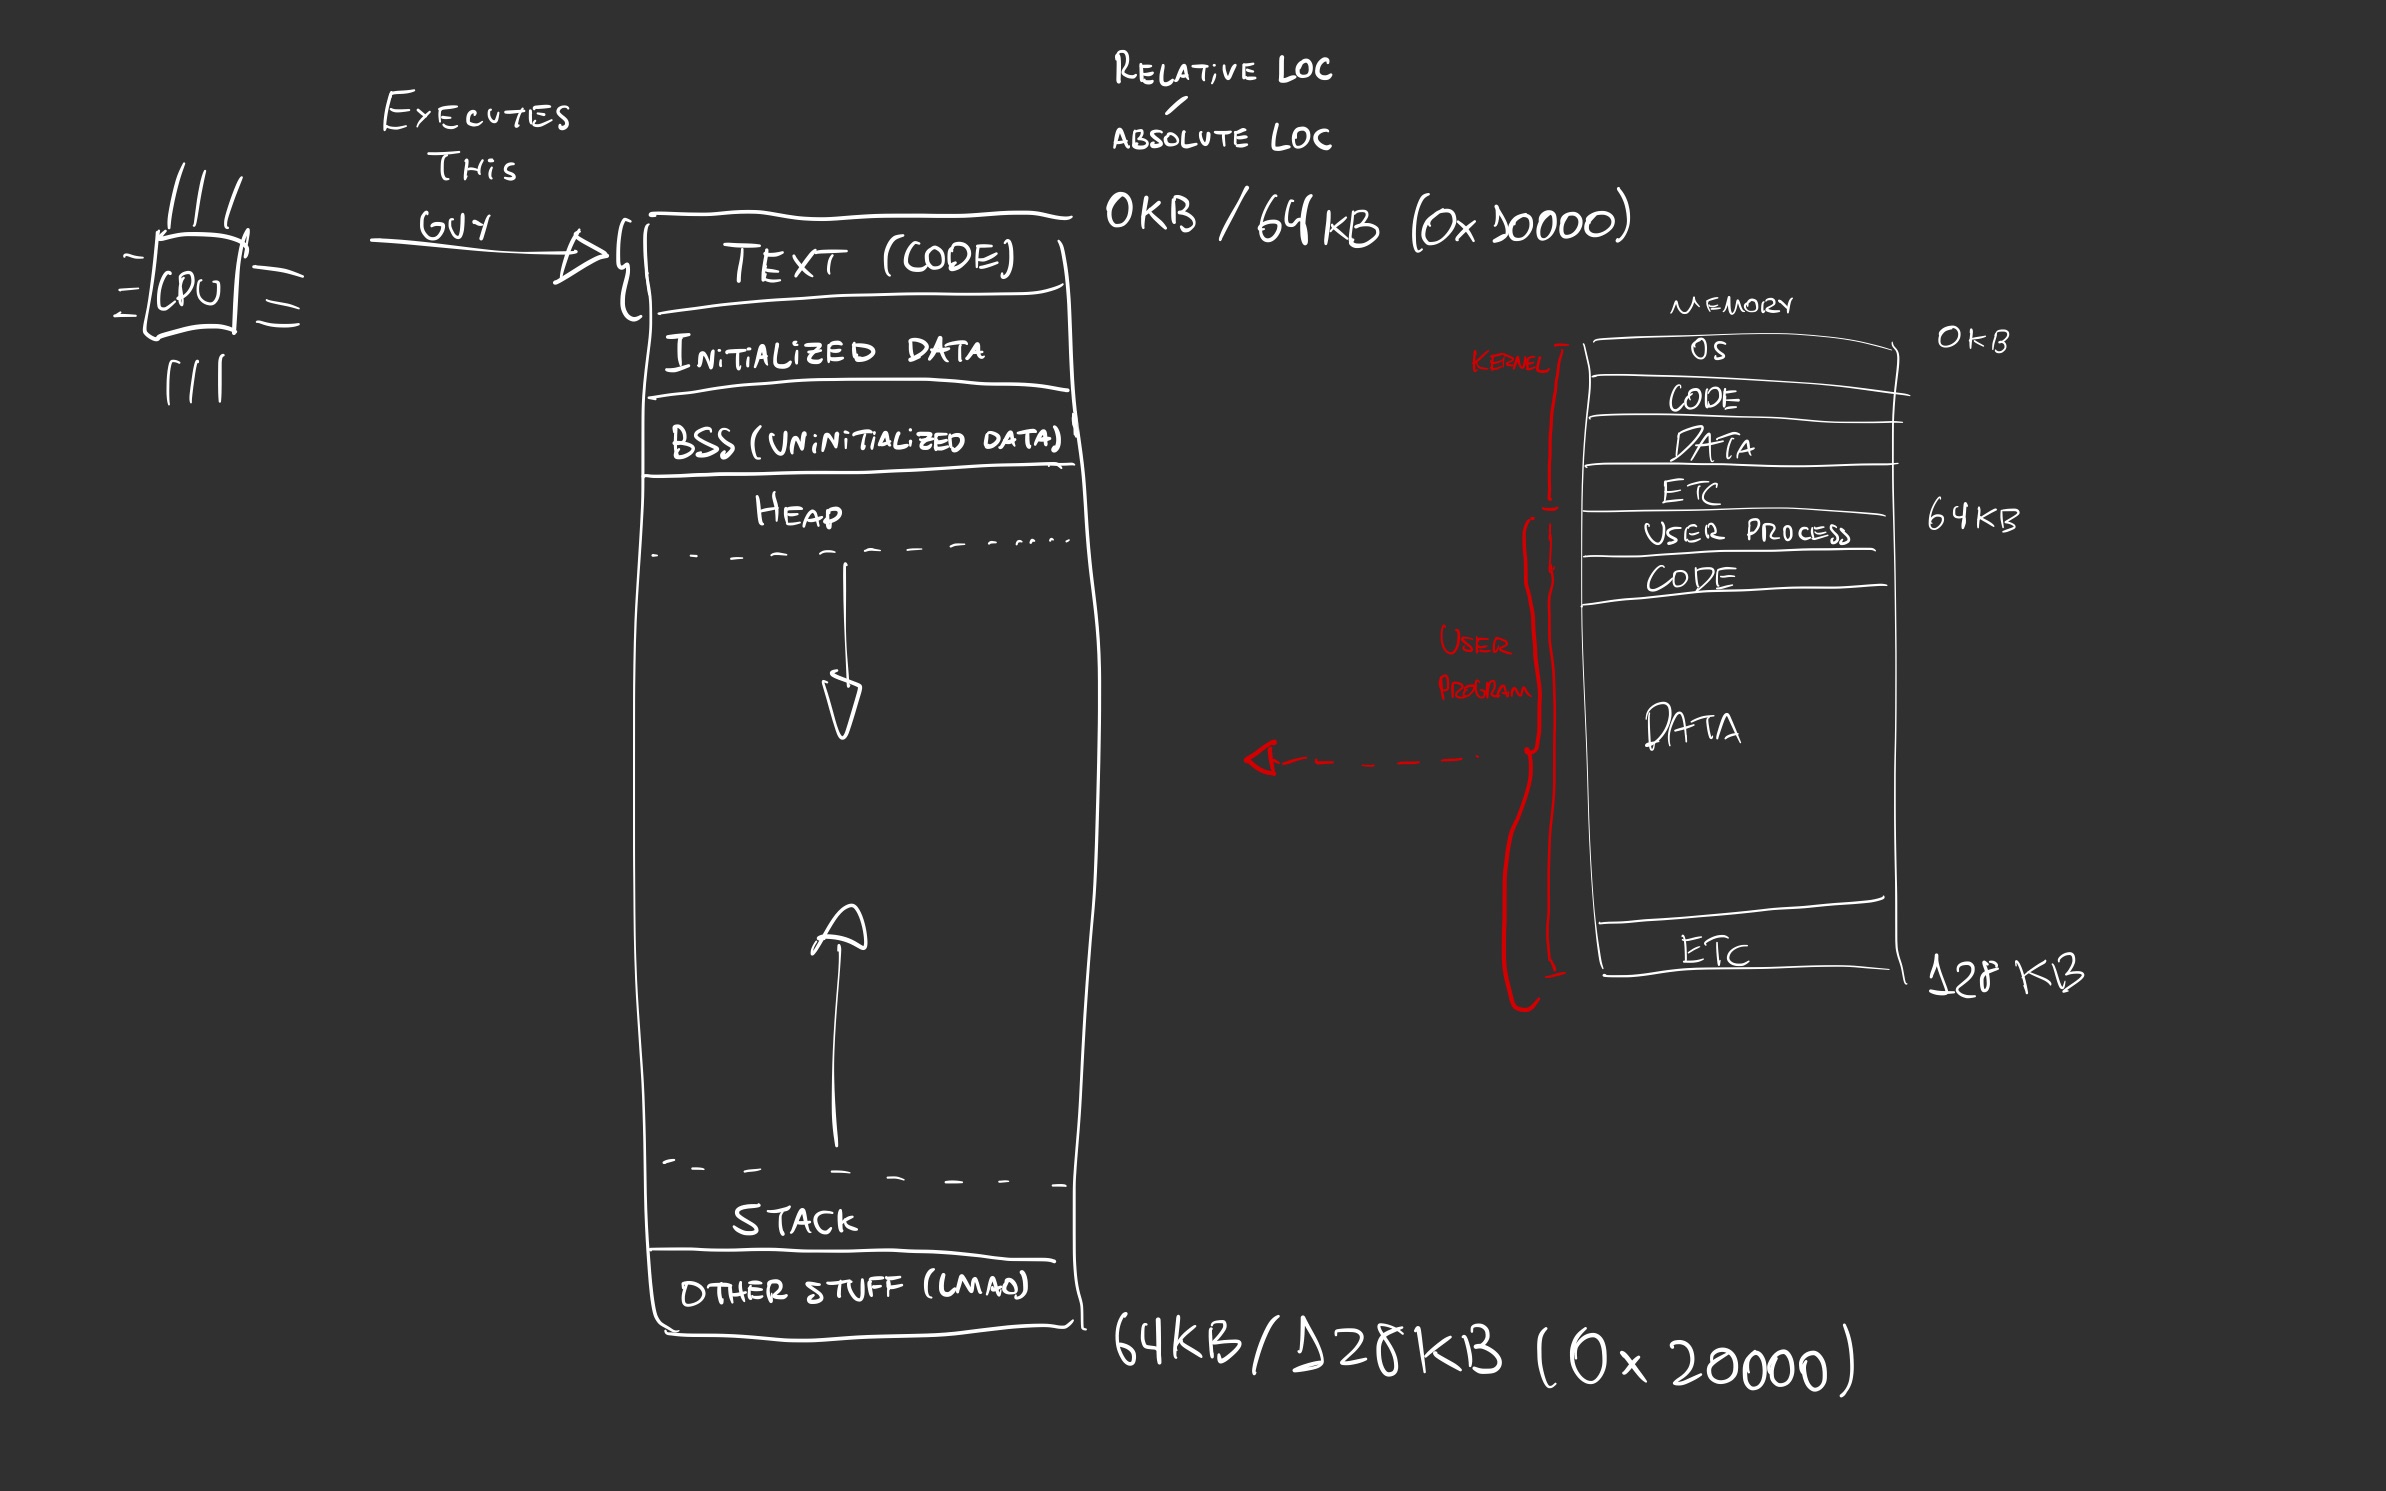
Let’s focus solely on 4 memory regions that the process occupies:
Initialized data
This is a memory region where we store global (static) and/or constant variables that have been initialized prior to the execution of the program. So, what’s that in C?
code
#include <stdio.h>

// if variable is not `const`, DON'T DO THIS
static const char *HELLO_MSG = "Hello, world!\n";

int main(int argc, char **argv)
{
    const int VALUE = 1;

	printf("%s", HELLO_MSG);
	printf("Value: %d\n", VALUE);

    return 0;
}
bash input
gcc e1.c -o e1 && ./e1 && rm -f e1
bash output
Hello, world!
Value: 1
Uninitialized data (bss/block started by symbol)
The bss is a memory region of the process reserved for keeping global (static) and/or constant variables that are not initialized with a value upon execution.
#include <stdio.h>

static char *message;
static int state;

int main(int argc, char **argv)
{
    printf("State: %d\n", state);
    return 0;
}
It’s not that they’ll keep uninitialized, but they’ll be supplied with empty
values instead. So if you declare a static pointer like the
static char *message, it’ll be just a NULL pointer. Avoid uninitialized pointers
like your life depends on it and you’ll be fine.
Stack
The stack refers to the region in memory that’s been allocated for a process that holds some data from the execution of the program. Things like:
- Local variables that are NOT static and constant;
- Function calls with arguments and returns data (stack frame);
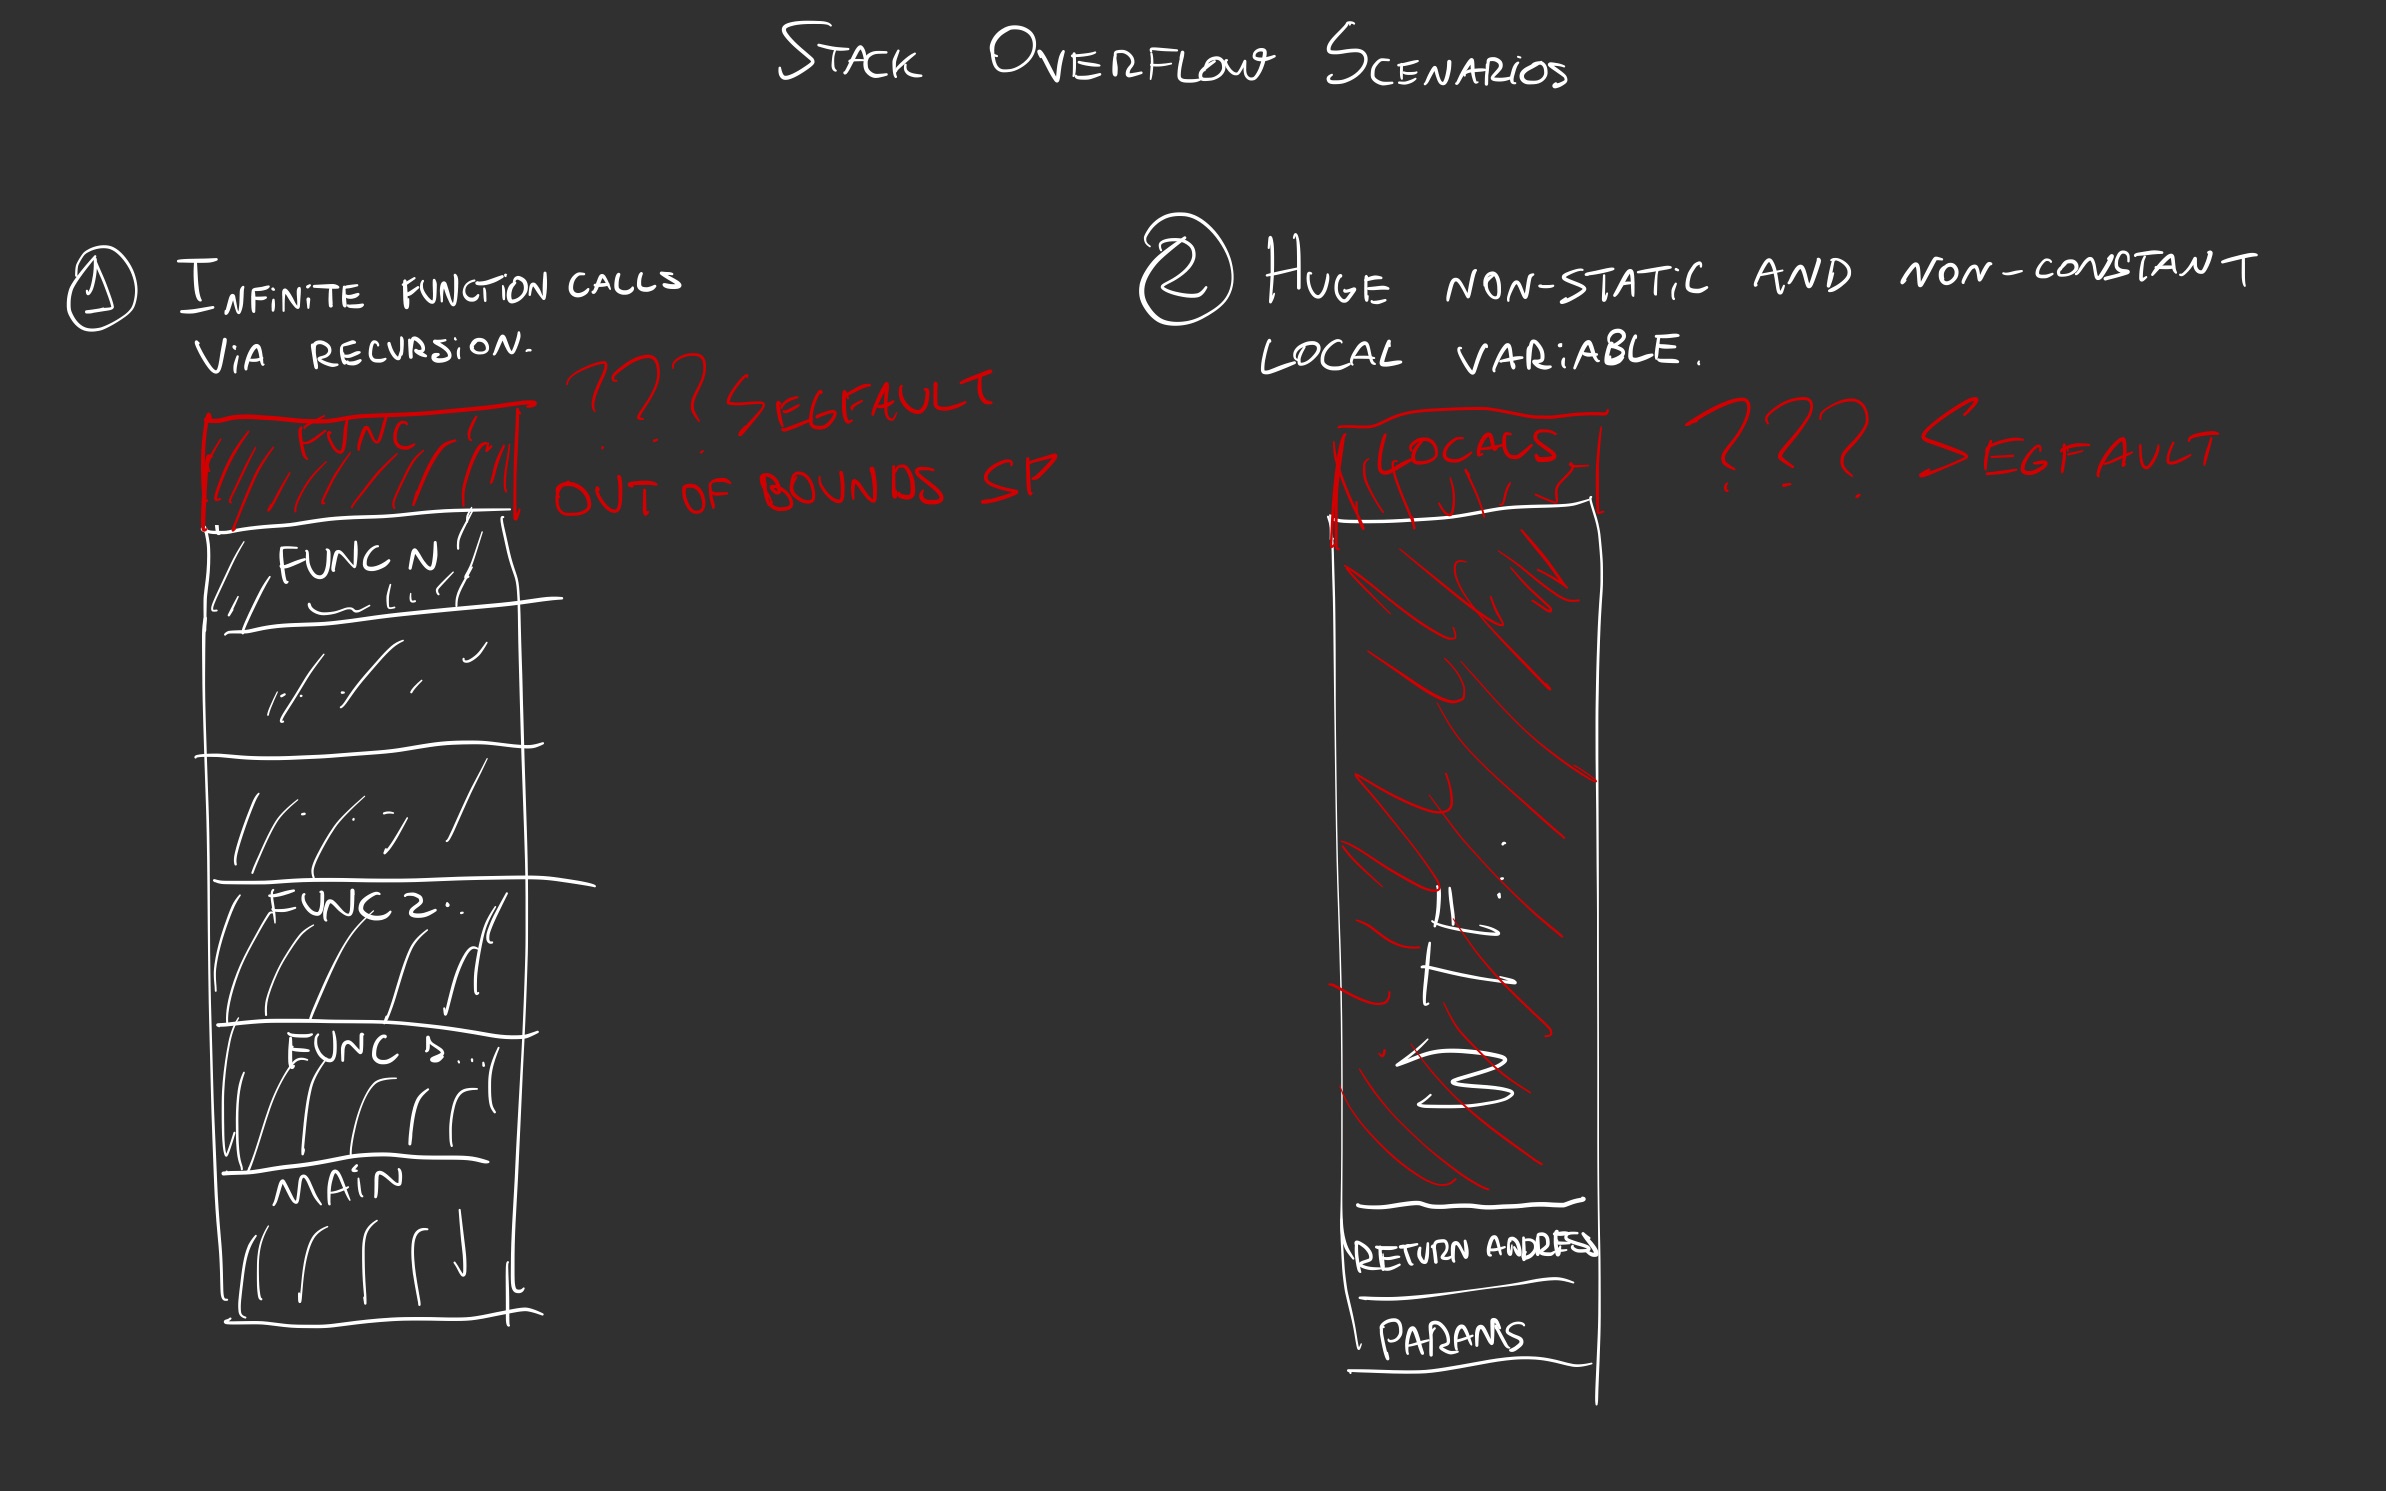
The stack keeps it all in. Fun fact, if you keep calling a function in an infinite recursion, like here:
#include <stdio.h>

int main(int argc, char **argv)
{
    func();
}

int func()
{
    return func();
}
Or by just trying to instanciate a huge ass local variable, like this array of double:
#include <stdio.h>

int main(int argc, char **argv)
{
    double x[1048576];
}
You’re setting up to have the good ’n old stack overflow in both scenarios!
In both cases, we’re using the stack in different ways: one to call a function, and another to keep local variables.
Variables in the stack are static, as its sizes cannot change. Whenever we are running a function, which is often referred to as a routine in this context, a stack frame is pushed on top of the stack as follows:
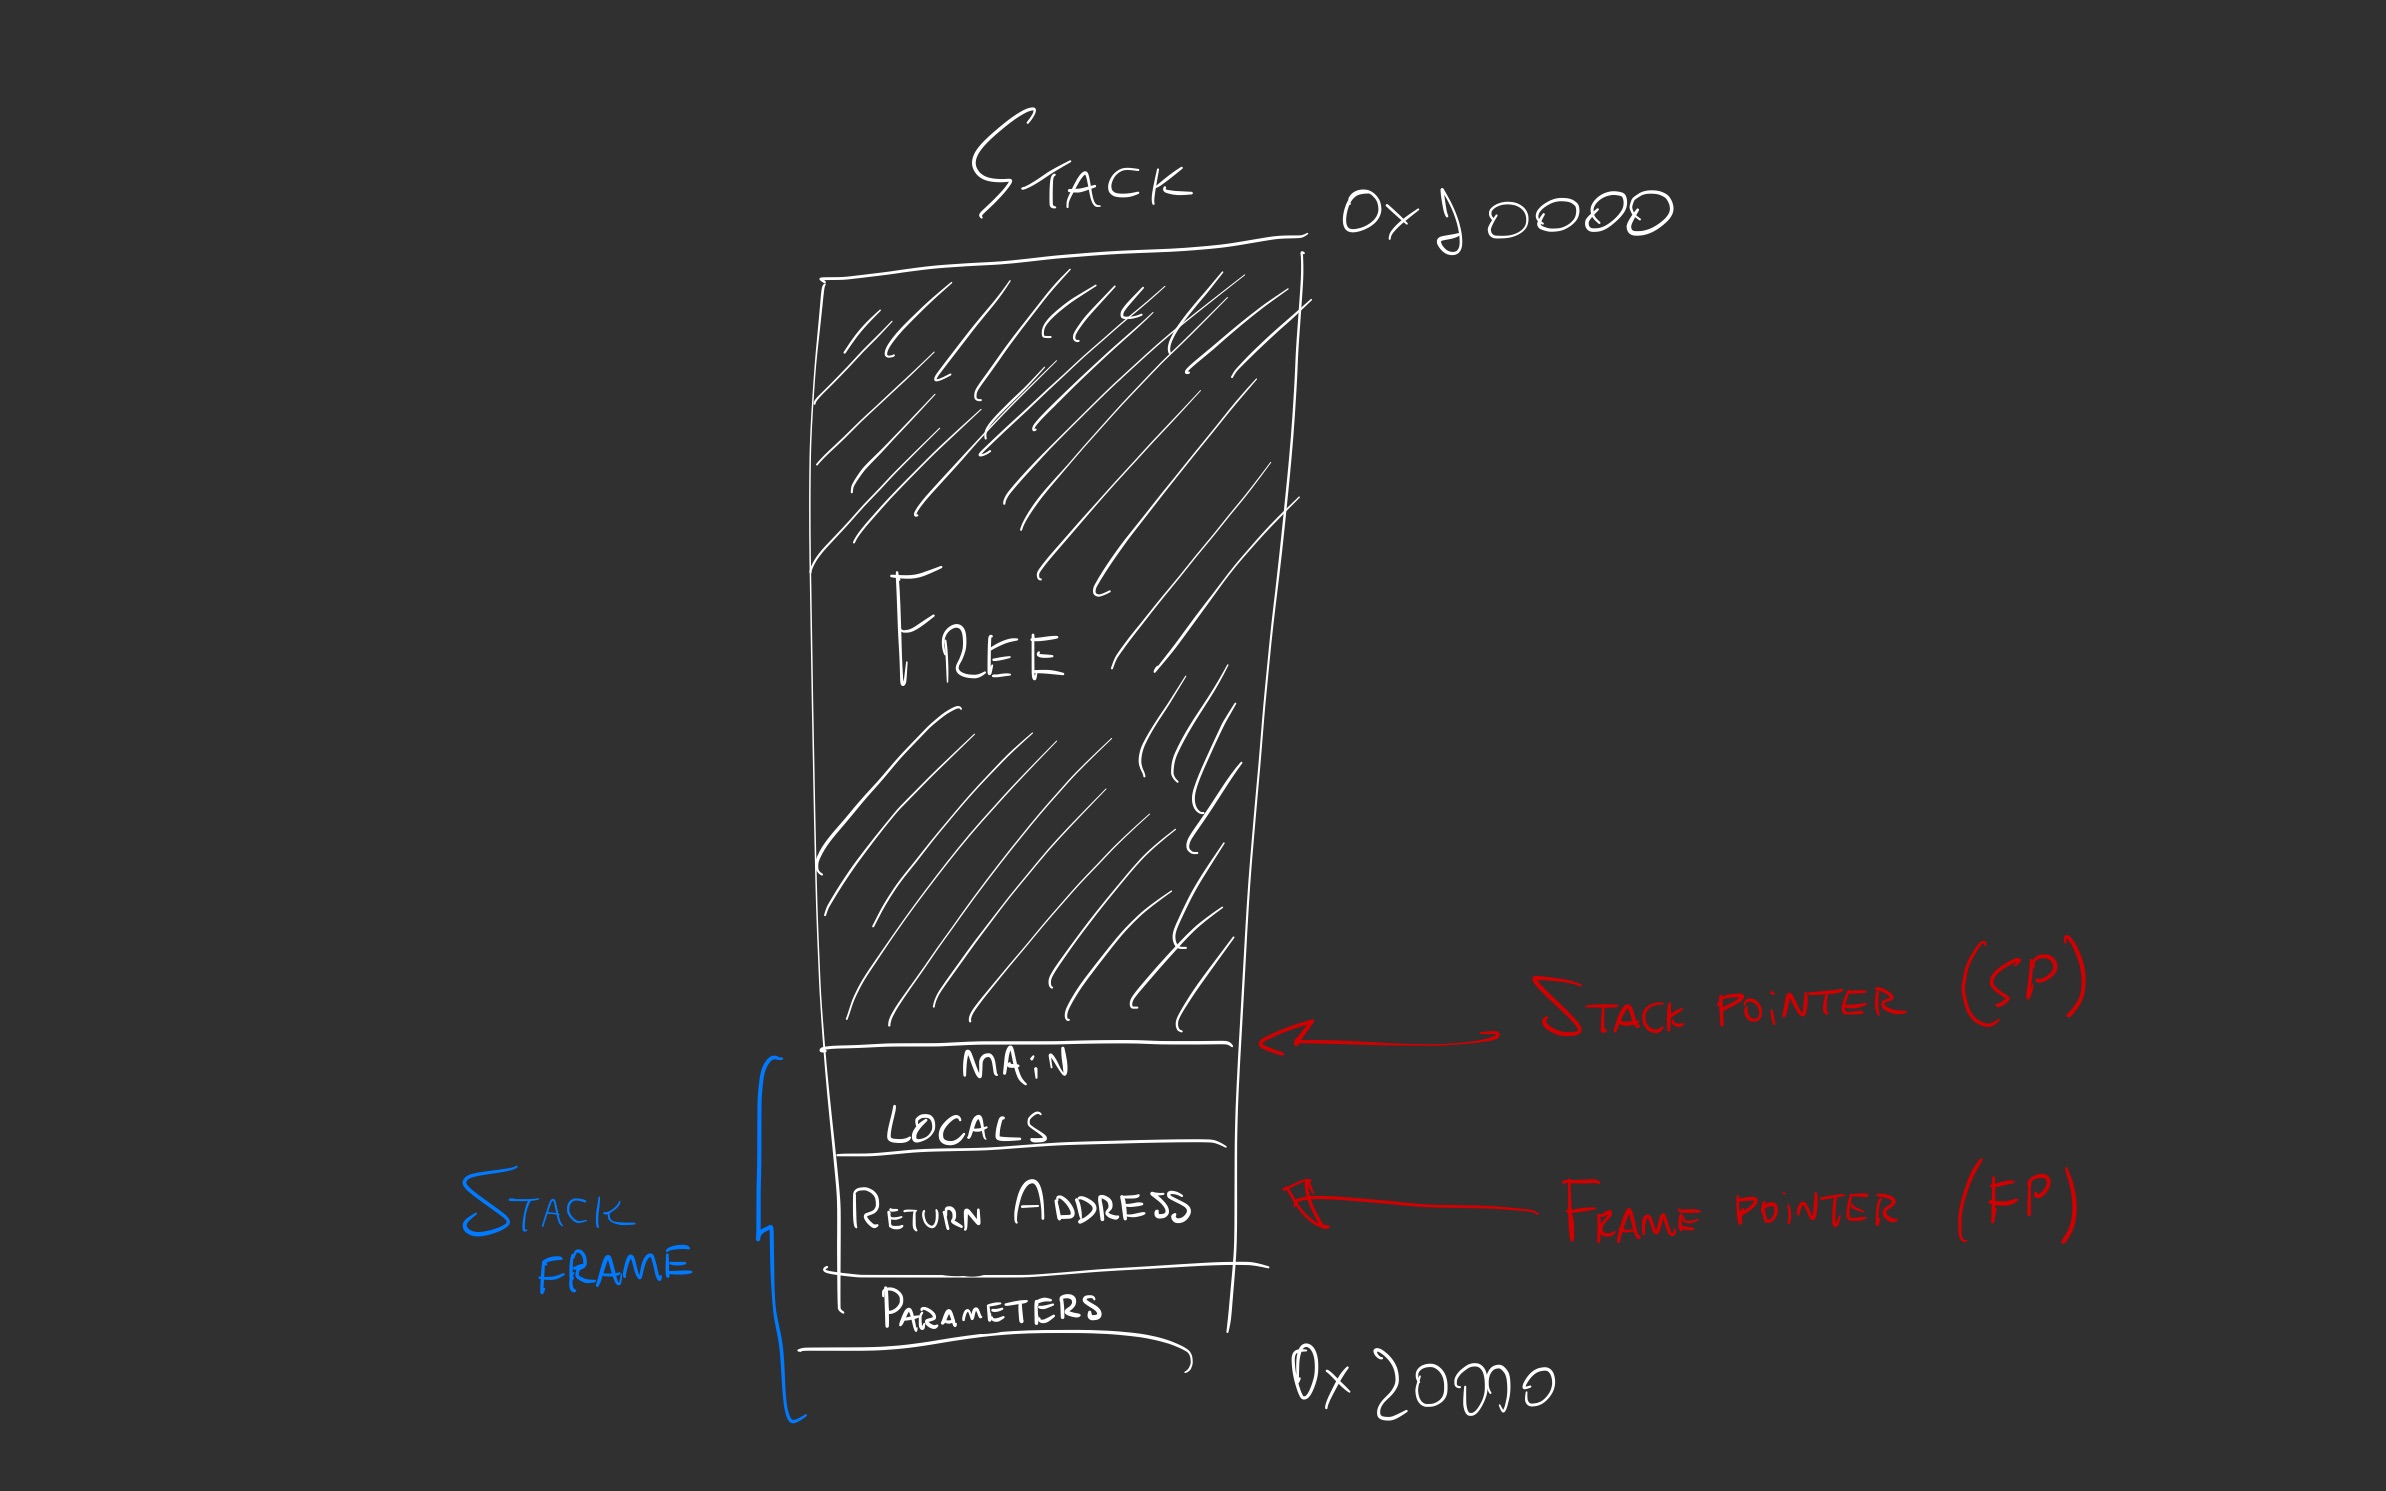
The stack pointer points to the top of the stack, and the frame pointer points to the frame itself, generally its address.
Conceptually speaking, the frame contains local variables of the function, the return address, and the parameters of the called function.
In the real world, it’s a little bit more convoluted, as we have CPU registers involved in keeping all of the information consolidated.
As of now, let’s see what happens in both cases, where we do an infinite recursive call to a function or keep a huge local variable:
Heap
The heap is a different beast because variables from within can grow and shrink dynamically according to the program execution.
The way that it may be used is by using a technique called memory allocation, in which we order the program to save a bit of memory for later usage, and we use de-allocation whenever we’re done using it. Here’s an example:
#include <stdio.h>
#include <stdlib.h>

int main(int argc, char **argv)
{
    char *my_string = malloc(20 * sizeof(char));
    if (my_string == NULL) {
        return 1;
    }

    strcpy(my_string, "hello, world");
    printf("%s\n", my_string);

    free(my_string);

    return 0;
}
The main difference between the heap and the stack is that in the stack, it pre-allocates the memory according to local variable sizes before execution, and in the heap, it’s done at runtime, when a program is running at that instant.
A stack always guarantees that we might be able to create that local variable, however, we don’t have that guarantee while using the heap, hence the NULL check.
Also, it’s important to remember that if we allocate memory, we ALWAYS need to de-allocate whenever we’re done because of a problem called memory leak, which is memory that has been allocated falls out of the scope of the function you’re executing, and you cannot de-allocate it anymore during execution.
The illustration should show what may happen if we don’t free malloc’d memory:
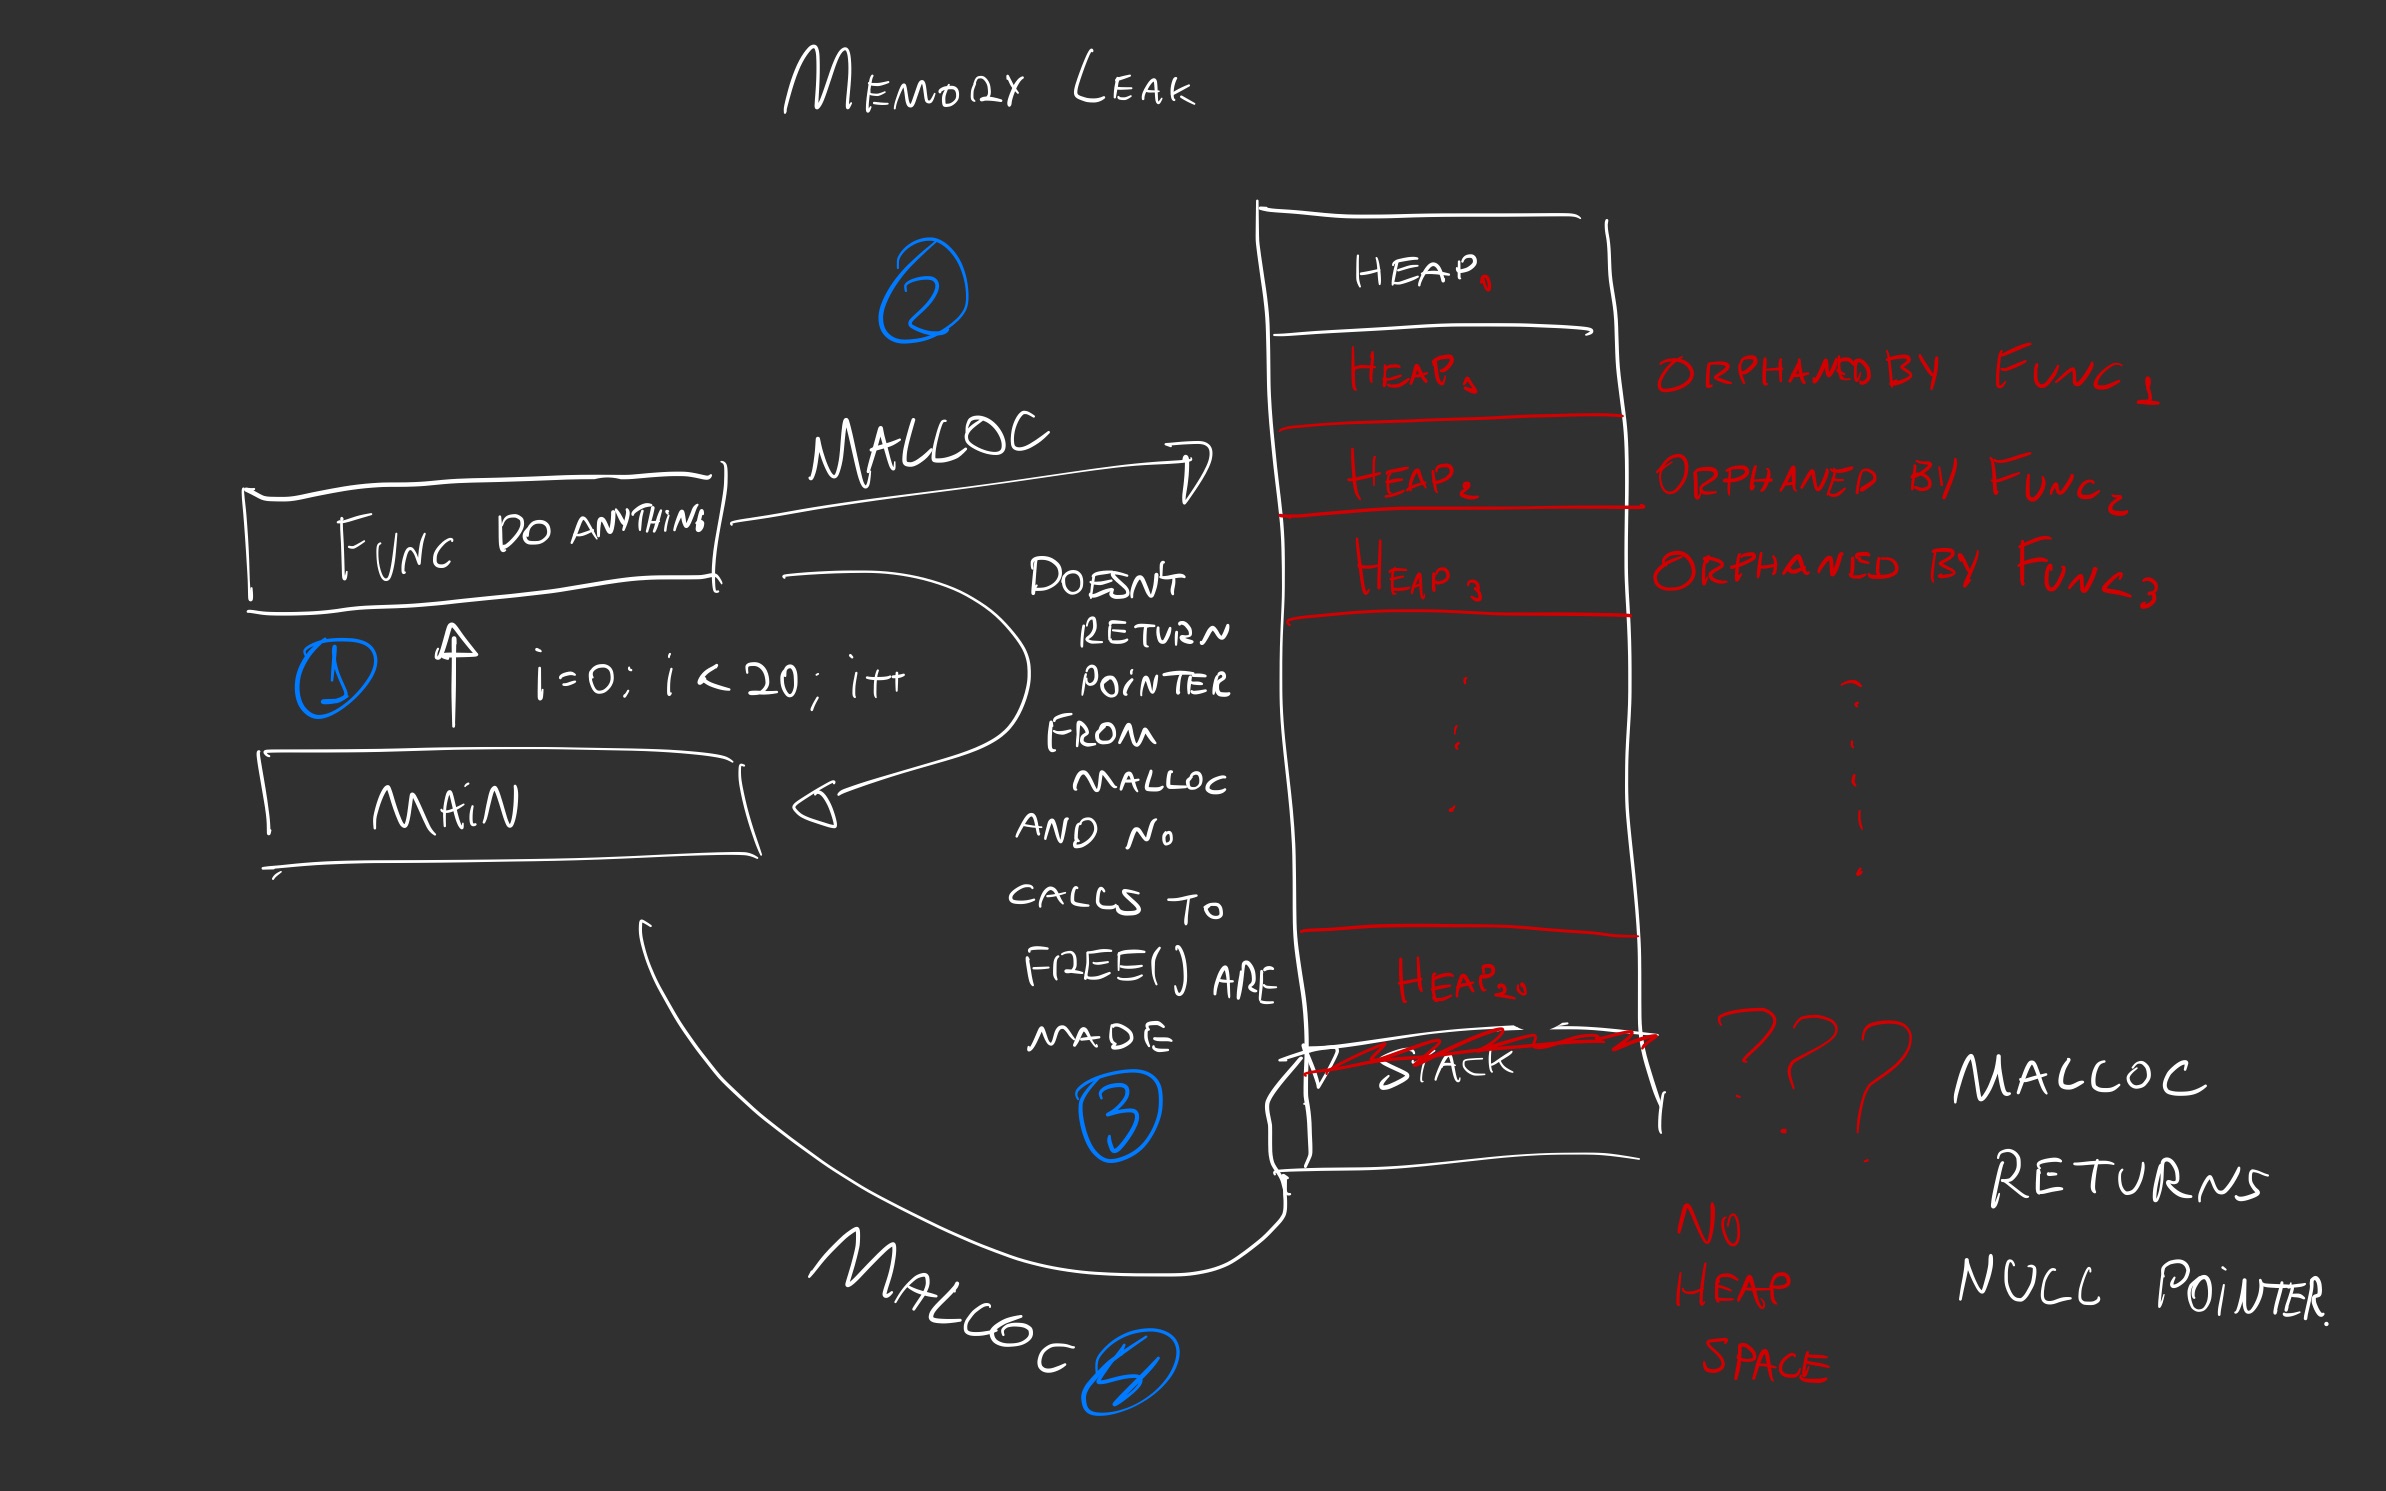
The main function may call another function that performs something with
mallocin an iterative manner;mallocis called, so the program reaches the heap to allocate some space for a variable with a given size and type;The function returns without giving the pointer back to the caller, or even so, it doesn’t call
free(pointer)to free the resources being used in the heap;If the heap is full, and
mainwants to callmalloc, the function won’t be able to allocate space, returning aNULLpointer.
If you keep on creating memory leaks, memory usage increases over time especially if the code you’re allocating memory in and not releasing gets executed time and time again.
Keep in mind that some programming languages may have a heap space capped, so you can crash a program due to hitting a limit in the heap usage.
We must remember that, usually, memory leaks are not that big of a deal for short-lived programs, because the OS can manage memory really well whenever the program finishes its execution.
However, in long-lived programs, and perpetual programs, it’s a big deal. You probably don’t want an autopilot software from a Boeing 737-800NG that you’re flying in to be short-lived.
Go

Go is a programming language that’s designed to be a spiritual successor from C/C++ to generalistic programming with small touches of system programming3.
What I mean by small touches of system programming is that, while it has some relatively low-level API to system components, where you can use pointers, it still has a Garbage Collector, which is an embedded program that scavenges and reclaims memory that has been allocated and it’s out of scope.
The real usage for that is simply productivity to do generalistic programming, when memory constraints are not of a big deal.
Most programs like REST APIs are not in scale; ephemeral programs that execute once in a while; and programs within an environment with unlimited resources.
They don’t benefit from having that amount of control over memory like system programming languages have, like C/C++, Rust, or Zig.
What happens under the hood, though, it’s fairly complex and hides some traps for programmers who are not used to some performance nuances.
Garbage Collection
Garbage Collection is a memory management technique that manages memory allocation, scavenging and reclaiming it back to the OS when not needed under the heap memory region.
At the very least, almost all non-system programming languages have it embedded as a Garbage Collector, so it’s not exclusive to Go.
The real catch is to understand how it works specifically for it. If you want to read the whole ordeal, please refer to the GC guide for Go, but I’ll briefly explain how it works.
GC only works for data that’s under the heap region. So data that’s in the stack will not fall under its management, because when a function returns, stack memory is reclaimed automagically.
Remember the use-case for the heap usage: you want it if you don’t know the exact size that you’ll require for a variable (which is dynamic).
So dynamic arrays (in the case of Go, slices), hashmaps (in the case of Go, maps, or in Python, dictionaries), and all data types being referenced by pointers will fall under the GC management in order to determine its lifetime in a program.
package main

import "fmt"

type person struct {
    firstName string
    lastName string
}

func main() {
    sl := []uint64{} // `malloc()`
    sl1 := make([]uint64, 0) // `malloc()`
    m := make(map[string]uint64) // `malloc()`
    p := &person{
        firstName: "Carlos",
        lastName: "Damazio",
    } // won't `malloc()`, but the GC keeps track of pointers for references in memory

    sl = append(sl, 0) // in C, you'd call `realloc()` so you can add the new data
    sl1 = append(sl1, 0) // same as above
    m["hello"] = 0 // same as above
    fmt.Println(p.firstName)
}
With that said, another thing to understand is the kind of GC being in use, which in Go is the tracing garbage collector.
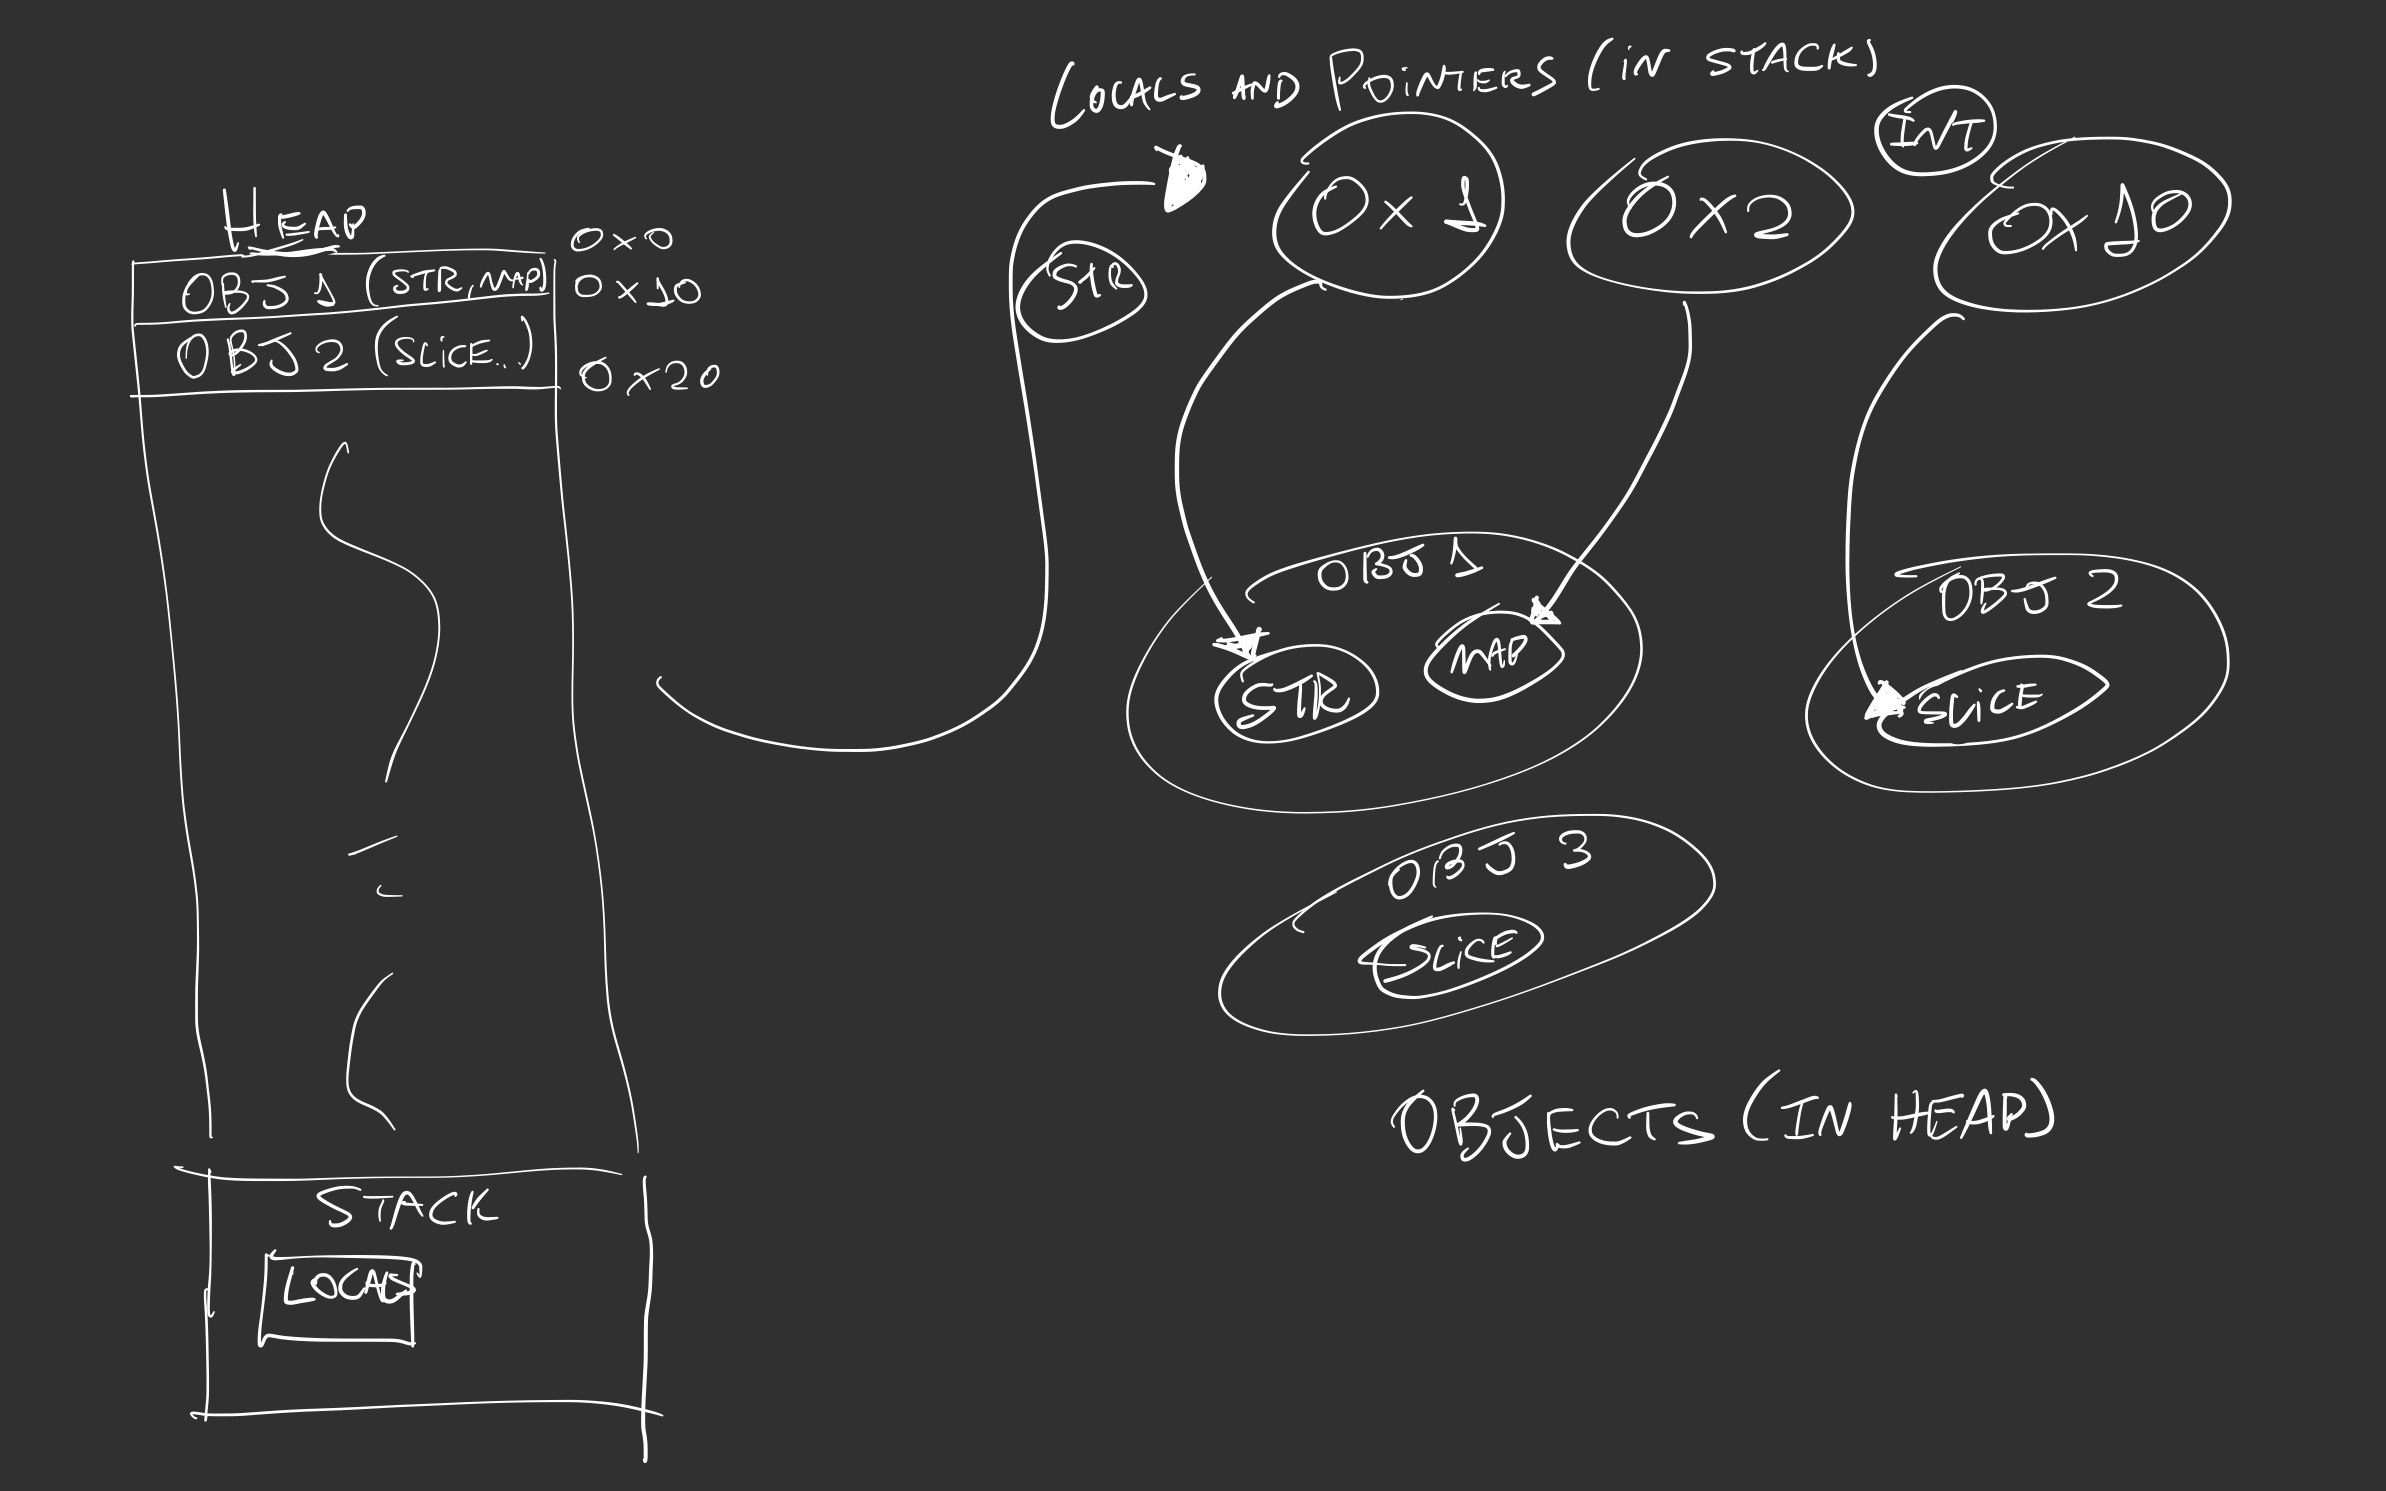
This kind of garbage collector uses a technique called mark-sweep. To understand how it’s applied, unfortunately, I need to introduce two new concepts regarding data being held in both stack and heap:
- Object: dynamically allocated memory space which may contain one or more Go values (variables);
- Pointer: memory address of a Go value, usually notated as
*T, where T is the type.
When a Go program is compiled, the compiler can determine the lifetime, or how long a certain variable should exist.
Local variables are bound to be reclaimed as soon as the function finishes. And we know that dynamically sized variables are within the heap.
However, if by any means we have a pointer that… points… to either a statically or dynamically sized variable or two, the compiler doesn’t know for how long that variable should exist, so it escapes to the heap.
Together, the Object and Pointer form an object graph as shown in the illustration:
The mark-sweep technique consists of two independent processes from the GC:
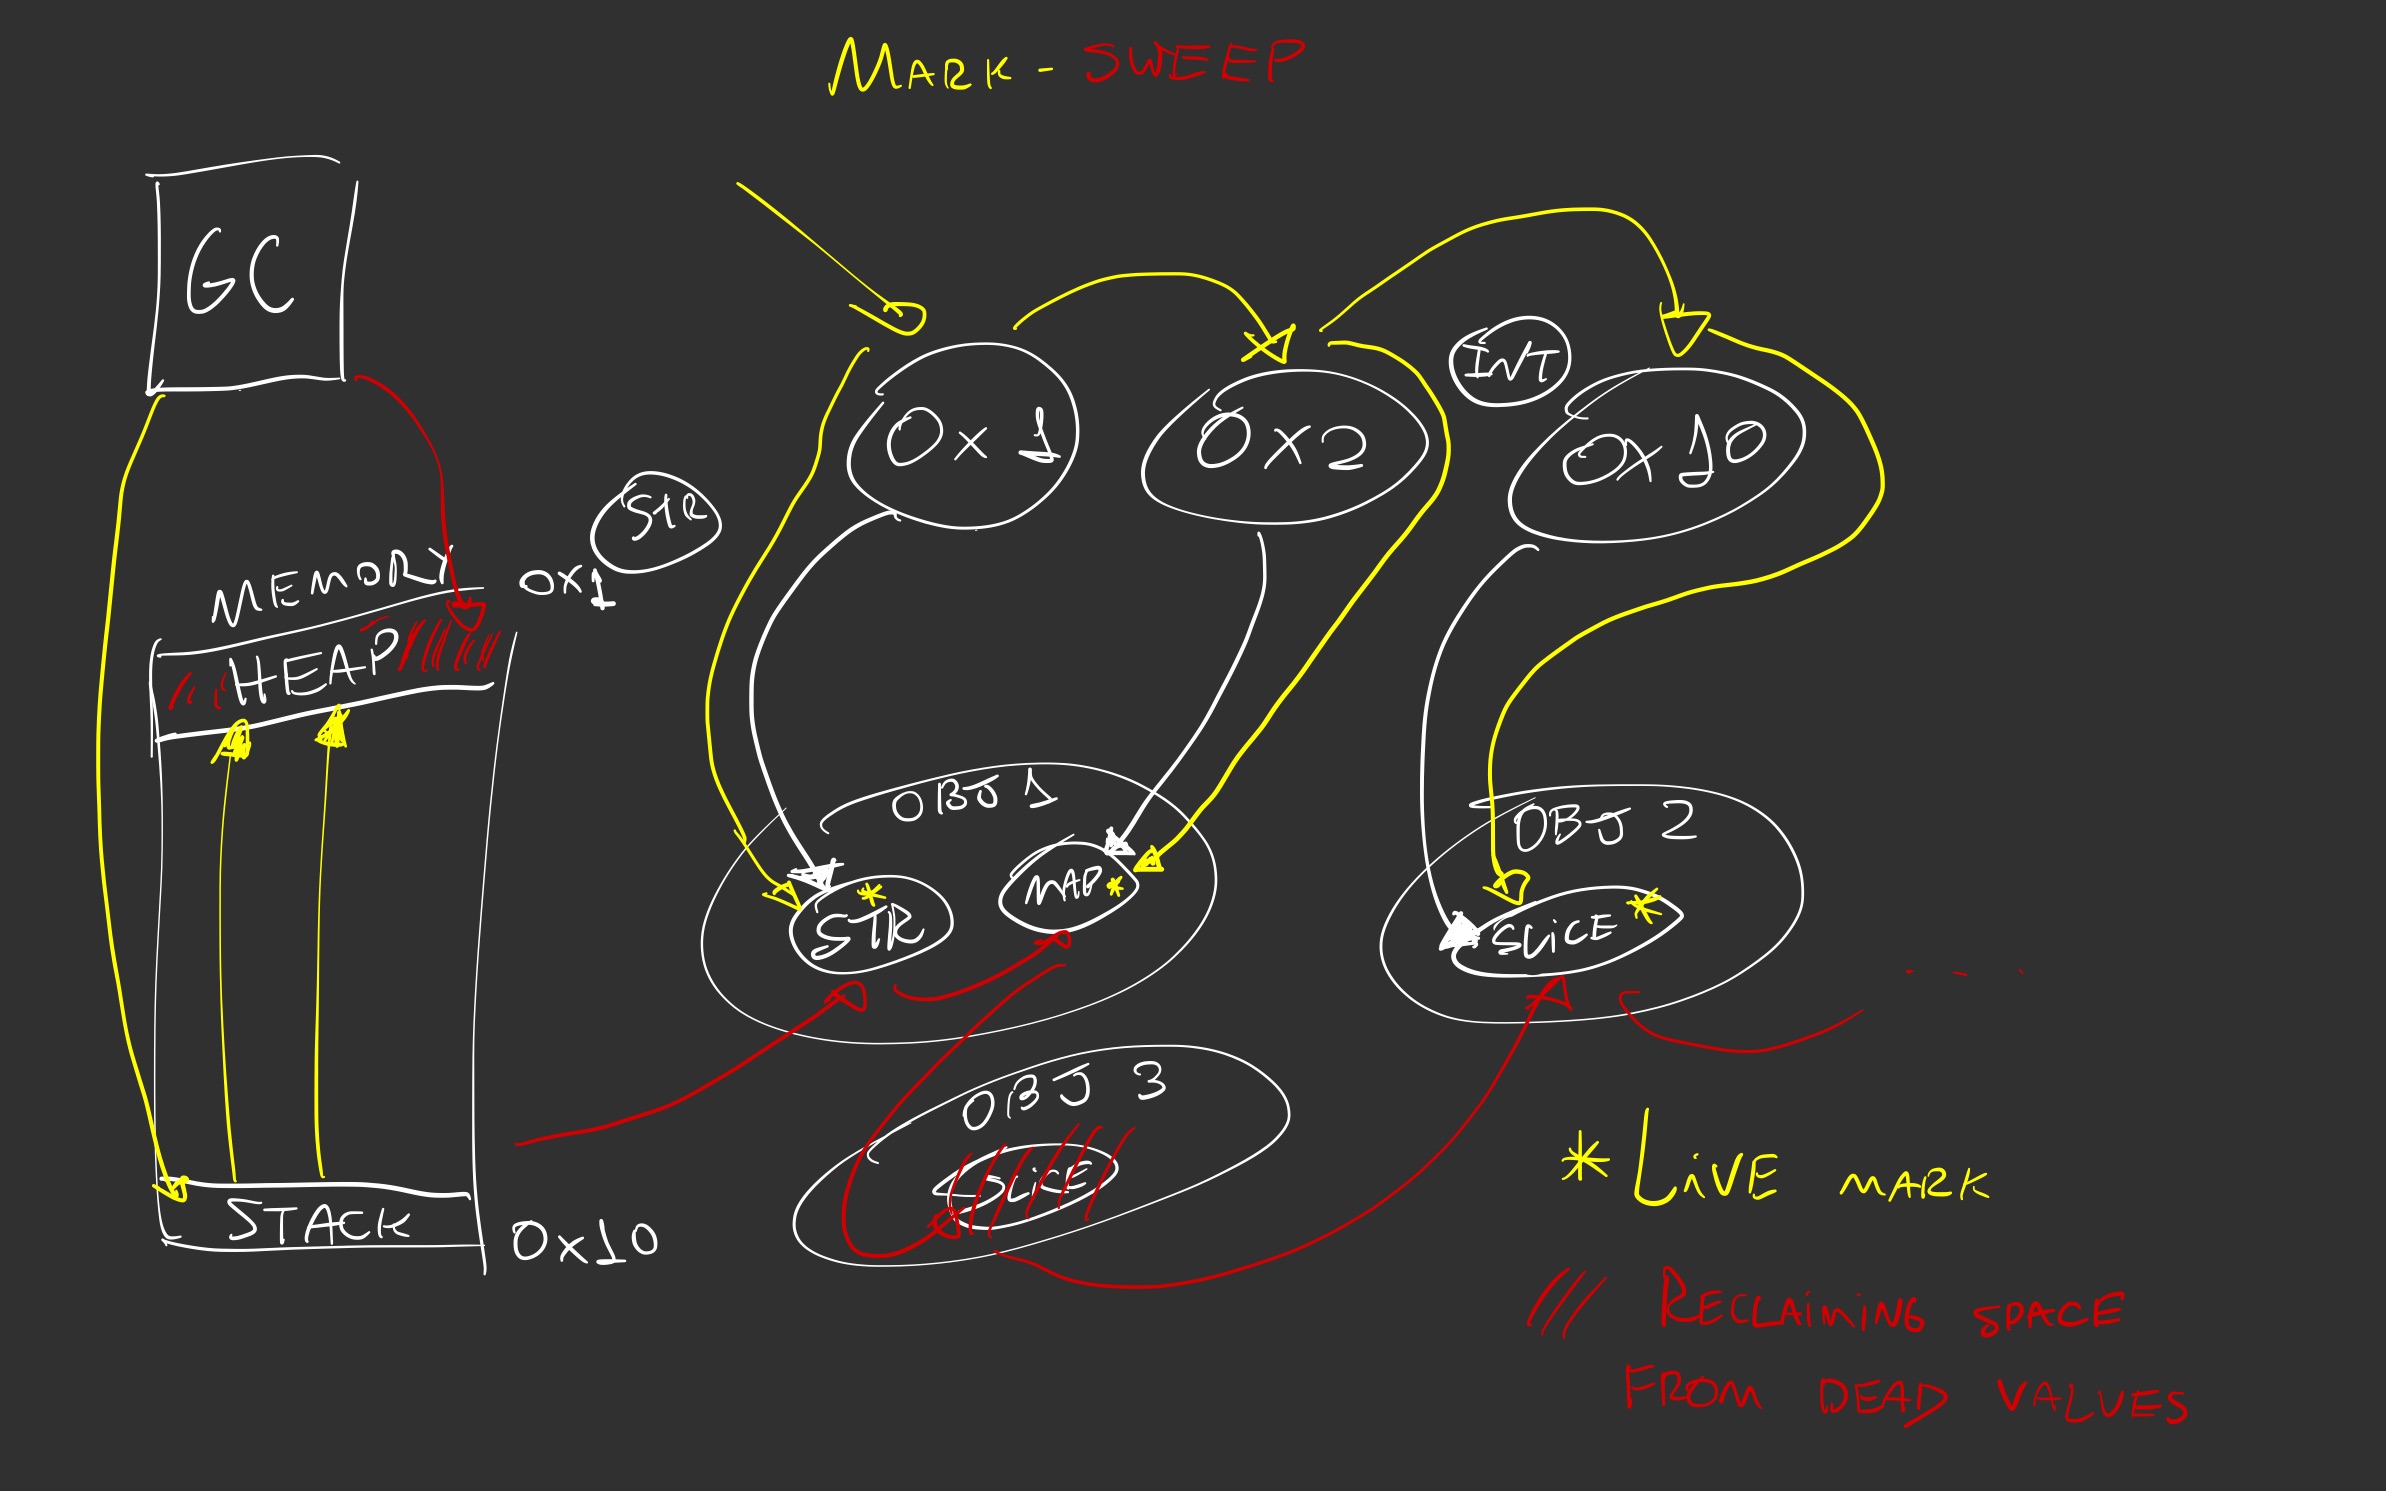
Sweep: process to scavenge and reclaim heap space occupied by dead Go values, meaning that they don’t have any reference and might be reclaimed back to the OS.
Mark: process to mark live Go values within objects, meaning that they have some reference on it and shouldn’t be scavenged by the GC. It starts traversing the object graph by those values’ roots: the pointers referenced in the process stack.
Together, this process of sweeping -> off -> marking counts as a single GC cycle. For more details about optimizations and implementation details, refer to the Go GC guide in the sources.
How to debug memory usage in Go
Well, with that said, there’s actually no need to worry about memory allocation and management because with GC, rest assured, you won’t need to do it at all.
However, note that you can still face some issues if you’re disregarding some guidelines in doing a proper optimization in the long run.
Let me list some of the pitfalls that one may fall into:
- Misuse of dynamic slices (buffering records);
- Passing values instead of pointers;
- Embedding structs within structs;
context.Background()’s long-term usage outsidemain();- The excessive number of goroutines.
In a huge codebase, it might be a bit difficult to pinpoint where a leak might be occurring. So this is why profiling is necessary: a process that analyzes a program’s resource usage such as memory, CPU, traces, mutexes, goroutines, and many more.
We have two approaches we can use in order to do so.
runtime.MemStats
The package runtime, as stated
here, interacts with runtime
operations of the programming language, which in turn can expose resource usage,
such as memory. We have two structs that we can use to evaluate its usage:
runtime.MemProfileRecord: This struct acts like a snapshot and a brief summary of the memory usage profile. For instance, you can evaluate the amount of memory being used in the bytes unit, the number of Objects in use, and the stack trace associated with the snapshot.runtime.MemStats: Like the above, it acts like a snapshot, but may show more information in regards to memory usage.
You may use one or the other, they show the same metrics, however, MemStats
may show whether you have a peak memory usage that may surpass the resource
limits you’ve determined for your environment (i.e. 2GiB of RAM usage).
Also, it contains a good amount of GC metrics. For a more detailed view, I’d definitely go with it.
There’s no pre-requisite to use it, you just import the runtime package as it
comes from the standard library.
package main

import (
    "fmt"
    "os"
    "runtime"
    "time"
)

const logFormat = "%s - %s: %2f - %s: %2f - %s: %2f - %s: %d;\n"

func main() {
    logFile, err := createLogFile()
    if err != nil {
            panic(err)
    }
    defer logFile.Close()


    var m runtime.MemStats
    runtime.ReadMemStats(&m)

    if err := writeMetrics(logFile, &m); err != nil {
            panic(err)
    }

    var slice []uint64
    for i := 0; i < 20; i++ {
            slice = append(slice, uint64(i))
    }

    runtime.ReadMemStats(&m)
    if err := writeMetrics(logFile, &m); err != nil {
            panic(err)
    }
}

func createLogFile() (*os.File, error) {
    logFile, err := os.Create("usage.log")
    if err != nil {
        return nil, err
    }

    return logFile, nil
}

func writeMetrics(logFile *os.File, m *runtime.MemStats) error {
    if _, err := fmt.Fprintf(
        logFile,
        logFormat,
        time.Now().Format(time.UnixDate),
        "HeapAlloc in MiB",
        bytesToMiB(m.HeapAlloc),
        "HeapSys in MiB",
        bytesToMiB(m.HeapSys),
        "StackSys",
        bytesToMiB(m.StackSys),
        "NumGC",
        m.NumGC,
    ); err != nil {
        return err
    }

    return nil
}

func bytesToMiB(v uint64) float64 {
    return float64(v) / 1024 / 1024
}
This snippet shows how we can use it:
- We declare a non-initialized
MemStatsstruct; - We call the
runtime.ReadMemStatsand provide the pointer of the struct; - Then, we print it to a log file.
We repeat the same process every time we want to take a snapshot of the memory usage at some point in the program.
The documentation of this struct can provide in detail what each field represents, but in my own words:
HeapAllocis the amount of bytes being actively allocated in the heap;HeapSysis the maximum amount of bytes that have been allocated in the heap at any time within the program’s execution;StackSysis the number of bytes being used in the stack plus the number of bytes obtained from the OS for any OS threads that eventually may spawn;NumGCis the number of times that the GC cycle has occurred in the program.
We can use this to demonstrate how one can measure how much memory a program can take at a given point. Let’s run the above example real quick:
bash input
go run cmd/main.go && cat usage.log
bash output
Tue Nov 21 09:32:18 -03 2023 - HeapAlloc in MiB: 0.128555 - HeapSys in MiB: 3.781250 - StackSys: 0.218750 - NumGC: 0;
Tue Nov 21 09:32:18 -03 2023 - HeapAlloc in MiB: 0.133919 - HeapSys in MiB: 3.781250 - StackSys: 0.218750 - NumGC: 0;
As you can see, the slice allocation took a little heap space, but nothing so dramatic with it.
Since the program didn’t run long enough and no functions were involved with
pointer operations and anything like that, we don’t see GC activity happening,
hence the number of GC cycles being zero in NumGC.
Files/logging are not the only way to do profiling on an application, pprof is
a useful profiling and visualization tool to do that as well.
pprof
pprof is a profiling visualization and analysis tool created by Google, the
same company that created the Go programming language.
It’s mostly written in Go, and its end goal is to create a visualization
representation and analysis of the profiling data generated by the program’s
execution statistics that are represented in profile.proto format, which is a
protocol buffer that exhibits a set of call stacks and symbolic information.
If you happen to have Go installed, there’s no need to install pprof since
it’s embedded within the standard library in the package net/http/pprof. For
more information, you can check its source code in
src/net/http/pprof/pprof.go.
Again, if we want to understand how our programs are misusing memory, we need to understand how to fetch the information from it, and it’s quite simple if you already have a Go project.
How to use pprof
The simplest way is to import the said package into your program, generally,
it’d go into package main along with bootstrapping code within it, and then
you start an HTTP server and use an available port:
package main

import (
    _ "net/http/pprof"

    "github.com/pkg/profile"
)

func main() {
    // bootstrap code
    // start profiler
	defer profile.Start(profile.MemProfile).Stop()

    // create a goroutine to run pprof server
	go func() {
		if err := http.ListenAndServe(":8080", nil); err != nil {
			panic("could not launch profiler server")
		}
	}()

    // continue doing what you're doing
}
The profile.Start(profile.MemProfile).Stop() is optional, if you don’t use it,
it’ll run all profiles described
here.
Of course, since we know what we’re dealing with, we might as well use a single
profiler.
So, how can we use it?
Assuming that you have the following program:
package main

import (
	"net/http"
	_ "net/http/pprof"

	"github.com/pkg/profile"
)

func main() {
	// bootstrap code
	// start profiler
	defer profile.Start(profile.MemProfile).Stop()

	if err := http.ListenAndServe(":8080", nil); err != nil {
		panic("could not launch profiler server")
	}
}
With that in mind, we can start fetching information from the profiler. Remember, we’re exposing the data within a program’s execution via HTTP, so we must use something to fetch an HTTP response out of it.
There are two ways of fetching the data:
- Either use
curlto fetch it fromhttp://localhost:8080/debug/pprof/heap; - Or use
go tool pprofdirectly.
Well, let’s go with the second option!
bash input
go tool pprof http://localhost:8080/debug/pprof/heap
bash output
Fetching profile over HTTP from http://localhost:8080/debug/pprof/heap
Saved profile in /Users/damazio/pprof/pprof.alloc_objects.alloc_space.inuse_objects.inuse_space.002.pb.gz
Type: inuse_space
Time: Oct 16, 2023 at 8:41pm (-03)
Entering interactive mode (type "help" for commands, "o" for options)
(pprof)
As expected, it’s a CLI tool that you may use to evaluate metrics in the profiler. How can we see the top 10 entities that are taking the most memory in the application?
(pprof) top10
Showing nodes accounting for 1180.89kB, 99.31% of 1189.07kB total
Dropped 12 nodes (cum <= 5.95kB)
Showing top 10 nodes out of 16
      flat  flat%   sum%        cum   cum%
     648kB 54.50% 54.50%  1180.89kB 99.31%  compress/flate.NewWriter
     320kB 26.91% 81.41%   532.89kB 44.82%  compress/flate.(*compressor).init
     200kB 16.82% 98.23%      200kB 16.82%  compress/flate.newDeflateFast (inline)
   12.89kB  1.08% 99.31%    12.89kB  1.08%  compress/flate.newHuffmanBitWriter (inline)
         0     0% 99.31%  1180.89kB 99.31%  compress/gzip.(*Writer).Write
         0     0% 99.31%  1180.89kB 99.31%  net/http.(*ServeMux).ServeHTTP
         0     0% 99.31%  1189.07kB   100%  net/http.(*conn).serve
         0     0% 99.31%  1180.89kB 99.31%  net/http.HandlerFunc.ServeHTTP
         0     0% 99.31%  1180.89kB 99.31%  net/http.serverHandler.ServeHTTP
         0     0% 99.31%  1180.89kB 99.31%  net/http/pprof.Index
At this point, there’s no activity happening apart from profiling being served
by the application, however, what happens if we make a slice instance with
millions of uint64 elements, which takes eight bytes each?
(pprof) top10
Showing nodes accounting for 806.80MB, 100% of 806.80MB total
      flat  flat%   sum%        cum   cum%
  806.80MB   100%   100%   806.80MB   100%  main.main
         0     0%   100%   806.80MB   100%  runtime.main
Well, so main is taking that much space in the heap alright… Also, take into
consideration that every time you run the pprof tool along with the server,
you’re taking more heap space as well:
(pprof) top10
Showing nodes accounting for 1.23GB, 100% of 1.23GB total
      flat  flat%   sum%        cum   cum%
    1.23GB   100%   100%     1.23GB   100%  main.main
         0     0%   100%     1.23GB   100%  runtime.main
What the hell, 400MB increased over a few debug requests.
So let’s revert the example back to simply running the web server. As it’s a visualization tool, how can we visually see how much memory is being used by the application in each function?
We can use a graph mode! There are multiple ways to visualize it, but you can
mostly use the web browser to show you the .svg file.
(pprof) top10
Showing nodes accounting for 28.74kB, 100% of 28.74kB total
Showing top 10 nodes out of 35
      flat  flat%   sum%        cum   cum%
    6.33kB 22.01% 22.01%     6.33kB 22.01%  bufio.NewWriterSize
    4.80kB 16.68% 38.70%     4.80kB 16.68%  time.LoadLocationFromTZData
    4.80kB 16.68% 55.38%     4.80kB 16.68%  time.readFile
    4.59kB 15.96% 71.34%     4.59kB 15.96%  net/textproto.initCommonHeader
    4.21kB 14.63% 85.98%     4.21kB 14.63%  runtime.malg
    4.03kB 14.02%   100%     4.03kB 14.02%  sync.(*Pool).pinSlow
         0     0%   100%     9.59kB 33.37%  github.com/pkg/profile.Start
         0     0%   100%     9.59kB 33.37%  github.com/pkg/profile.Start.func2 (inline)
         0     0%   100%     9.59kB 33.37%  log.(*Logger).Output
         0     0%   100%     9.59kB 33.37%  log.(*Logger).formatHeader

(pprof) web
The web directive in pprof will open a web browser so you can see the graph
image:
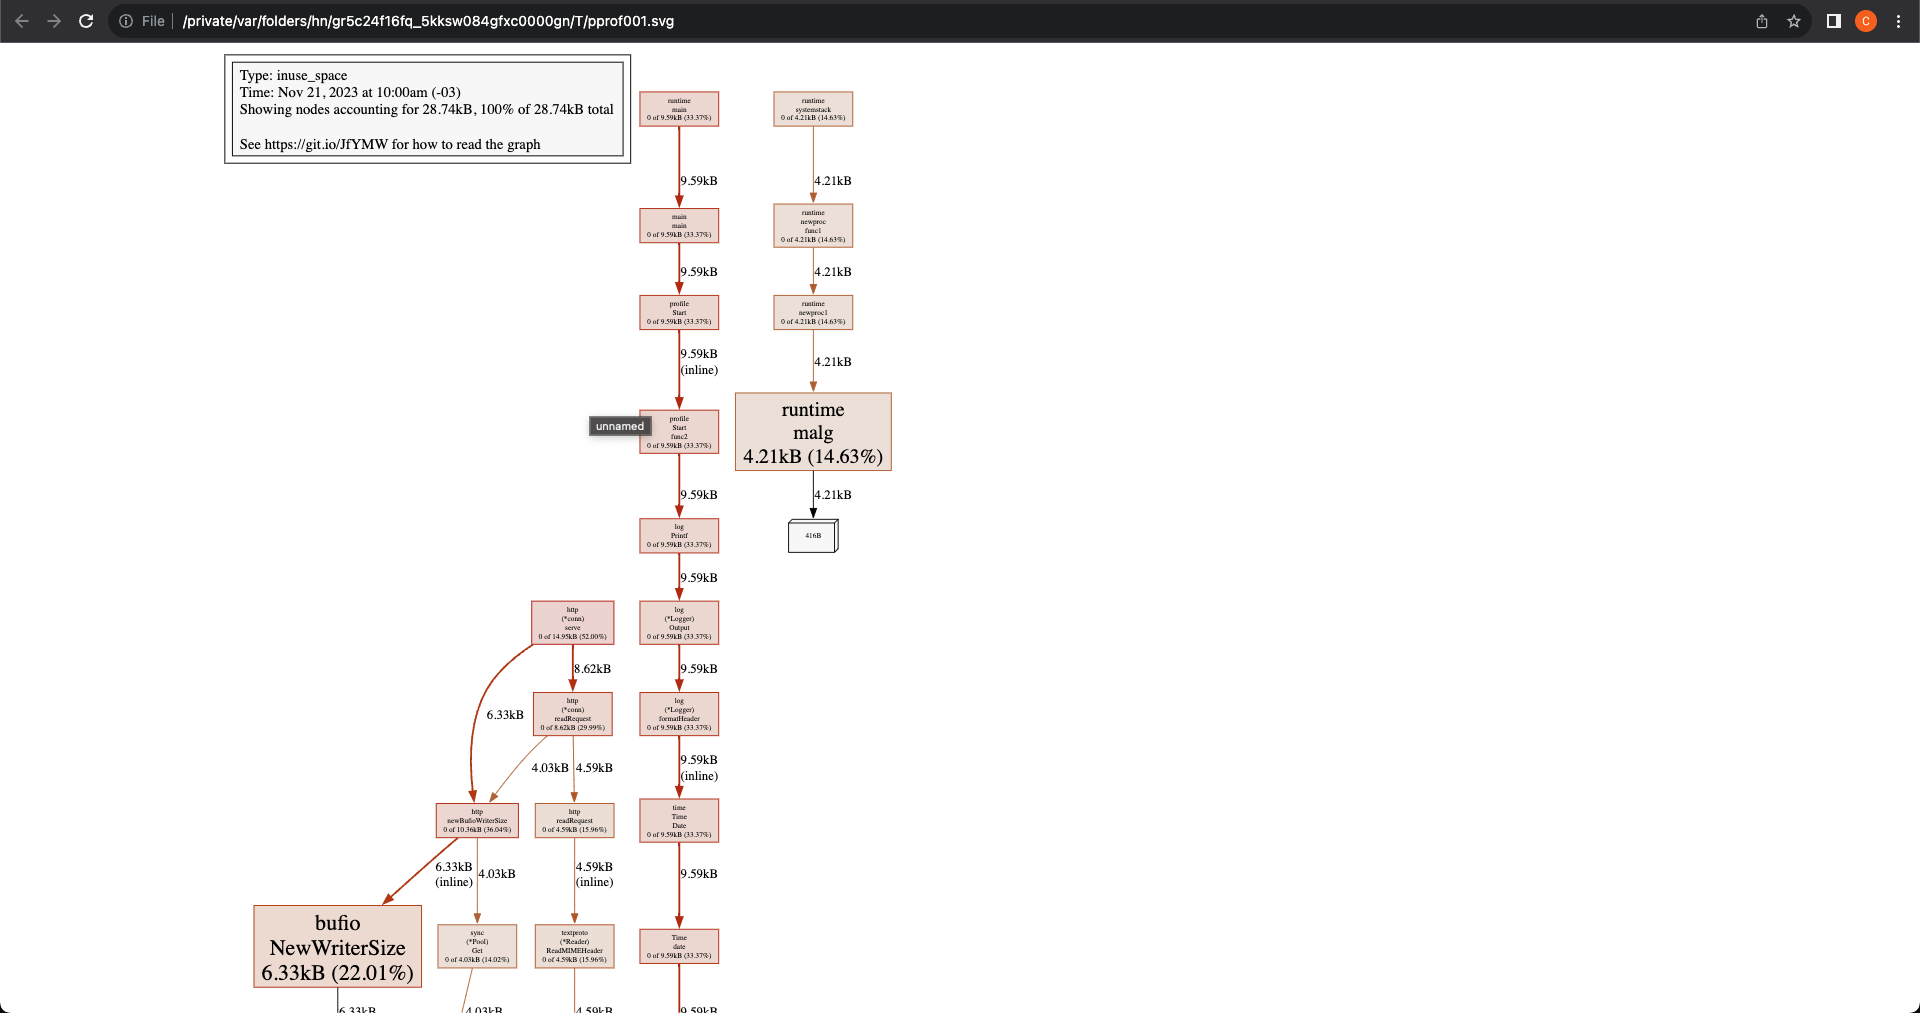
To comprehend the graph, here are some guidelines:
- Check the
.svgheader to know what the graph is about. In this case, it’s indicatinginuse_space, which refers to space being used in the heap; - In the same header, you can see how much the graph accounts for the total space being used by the application. In this case, the graph represents all function calls (100%) of the application;
- Each node in the graph represents a function call, and each function call can keep an amount of space being used, accounting for a percentage in that 100%;
- A function may call another function, hence the graph connection between
nodes in a unidirectional manner. In this case, the
mainfunction calls another function that cascades a set of functions required to start the profiling server;
Here are the options you may use with the web command:
(pprof) help web
Visualize graph through web browser
  Usage:
    web [n] [focus_regex]* [-ignore_regex]*
    Include up to n samples
    Include samples matching focus_regex, and exclude ignore_regex.
n: limits the number of nodes to show in the graph;focus_regex/ignore_regex: limits what can be shown in the graph.
With that said, one can see what’s going on with the application’s memory usage at a given time.
Now, let’s see how one identifies these issues happening in an HTTP server program.
Optimization scenarios
I’m going to present two scenarios that may be good for basic optimizations:
- Misuse of dynamic slices (buffering records);
- Embedding structs/slices within structs;
Reasoning
The reasoning behind the optimization for applications that need to scale is that HTTP servers are programs that aren’t expected to quit.
In the heap section, I explained how memory leaks occur in a programming language that doesn’t have GC embedded. Well, memory leaks may occur in GC-embedded languages in different ways, as I’ve stated above.
Given an HTTP server written with the following snippet:
package main

import (
    "fmt"
    "net/http"
    _ "net/http/pprof"

    "github.com/pkg/profile"
)

func startProfiler() {
    defer profile.Start(profile.MemProfile).Stop()

    if err := http.ListenAndServe(":8080", nil); err != nil {
        panic("could not launch profiler server")
    }
}

func hello(w http.ResponseWriter, req *http.Request) {
    fmt.Fprintf(w, "henlo\n")
}

func headers(w http.ResponseWriter, req *http.Request) {
    for name, headers := range req.Header {
        for _, h := range headers {
            fmt.Fprintf(w, "%v: %v\n", name, h)
        }
    }
}

func main() {
    go startProfiler()

    http.HandleFunc("/hello", hello)
    http.HandleFunc("/headers", headers)
    http.ListenAndServe(":8090", nil)
}
We may call the API using curl and assert performance with pprof like the
following:
bash input
curl -v http://localhost:8090/hello
bash output
*   Trying 127.0.0.1:8090...
* Connected to localhost (127.0.0.1) port 8090 (#0)
> GET /hello HTTP/1.1
> Host: localhost:8090
> User-Agent: curl/8.1.2
> Accept: */*
>
< HTTP/1.1 200 OK
< Date: Tue, 21 Nov 2023 16:11:56 GMT
< Content-Length: 6
< Content-Type: text/plain; charset=utf-8
<
henlo
* Connection #0 to host localhost left intact
And here’s the pprof report:
(pprof) top10
Showing nodes accounting for 1176.20kB, 99.21% of 1185.60kB total
Dropped 10 nodes (cum <= 5.93kB)
Showing top 10 nodes out of 19
      flat  flat%   sum%        cum   cum%
     648kB 54.66% 54.66%     1168kB 98.52%  compress/flate.NewWriter
     320kB 26.99% 81.65%      520kB 43.86%  compress/flate.(*compressor).init
     200kB 16.87% 98.52%      200kB 16.87%  compress/flate.newDeflateFast (inline)
    8.20kB  0.69% 99.21%     8.20kB  0.69%  net/http.Header.Clone (inline)
         0     0% 99.21%     1168kB 98.52%  compress/gzip.(*Writer).Write
         0     0% 99.21%  1181.43kB 99.65%  net/http.(*ServeMux).ServeHTTP
         0     0% 99.21%  1185.60kB   100%  net/http.(*conn).serve
         0     0% 99.21%     8.20kB  0.69%  net/http.(*response).WriteHeader
         0     0% 99.21%     8.20kB  0.69%  net/http.Error
         0     0% 99.21%  1181.43kB 99.65%  net/http.HandlerFunc.ServeHTTP
Calling the /hello endpoint results in 1MB of heap usage over time, but
remember that the GC may act up to reclaim dead values.
Let’s see some of the scenarios and how to optimize them.
Issue
An array, in the Go language context, is called a slice and it may be declared
with a fixed size (which pre-allocates memory and leaves empty spaces with nil
conformant values in place) or dynamic size (which doesn’t), like the following:
    // `make` guidelines:

    // make(<SLICE OR MAP TYPE>, <length as `int`>, <capacity as `int`>)
    // ommitting capacity, make takes the capacity with the length value by default

    // also, ommitting length makes both of them as zero, which means you cannot
    // access or assign indices, only `append()` will work, or else, you'll panic
    // the application with an out-of-bounds slice error

    sliceOne := make([]uint64, 10, 10)
    // len=10 cap=10 [0 0 0 0 0 0 0 0 0 0]

    sliceTwo := make([]uint64, 5)
    // len=5 cap=5 [0 0 0 0 0]

    sliceThree := make([]uint64)
    // len=0 cap=0 []

    // be careful when doing `make` with a slice or map with pointers, if you plan
    // on iterating it, you can accidentally panic the application with a nil pointer
    // dereference error

    sliceThree := make([]*struct{}, 3)
    // len=3, cap=3 [nil nil nil]
The catch here is that, by themselves, they’re all dynamic from within. You can
keep appending values by using append() and then it’ll double its capacity
until it hits the max again:
    // in theory, this should not be possible unless Go calls `realloc()` from within

    sliceOne = append(sliceOne, 1)
    // len=11 cap=20 [0 0 0 0 0 0 0 0 0 0 1]
The ease of use of a slice is not an understatement, it’s pretty flexible. However, just because it’s cheap, doesn’t mean it’s free[^fn5].
For example: imagine that I work in a government office and I’m building an
internal API. What happens if I try to pull ALL records of a Person and try to
expose them all at once?
type Person struct {
    Name     string
    LastName string
    Age      uint8
    ID       string
    Parents  []Person
}

func handlePerson(w http.ResponseWriter, req *http.Request) {
    // pretend this is a SQL fetching
    person := Person{
        Name:      "Carlos",
        LastName:  "Damázio",
        Age:       28,
        ID:        "f-off",
        Parents:   []Person{
            {
                Name:      "<Redacted>",
                LastName:  "Damázio",
                Age:       60,
                ID:        "f-off1",
            },
            {
                Name:      "<Redacted>",
                LastName:  "Damázio",
                Age:       63,
                ID:        "f-off3",
            },

        }
    }

    population := make([]Person, 0)
    for i := 0; i < 3500000; i++ {
        population = append(population, person)
    }

    time.Sleep(5 * time.Second)
}
Assuming that 3,500,00 is the whole of Brasilia’s population (my home town), we’re fetching and keeping it up in memory all the people.
Does pprof have anything to say?
(pprof) top10
Showing nodes accounting for 244.45MB, 100% of 244.45MB total
Dropped 7 nodes (cum <= 1.22MB)
      flat  flat%   sum%        cum   cum%
  244.45MB   100%   100%   244.45MB   100%  main.handlePerson
         0     0%   100%   244.45MB   100%  net/http.(*ServeMux).ServeHTTP
         0     0%   100%   244.45MB   100%  net/http.(*conn).serve
         0     0%   100%   244.45MB   100%  net/http.HandlerFunc.ServeHTTP
         0     0%   100%   244.45MB   100%  net/http.serverHandler.ServeHTTP
Hmmm… 244 megs… Not bad, how about the whole population of Brazil (210M approximately)?
(pprof) top10
Showing nodes accounting for 7.82GB, 100% of 7.82GB total
Dropped 48 nodes (cum <= 0.04GB)
      flat  flat%   sum%        cum   cum%
    7.82GB   100%   100%     7.82GB   100%  main.handlePerson
         0     0%   100%     7.82GB   100%  net/http.(*ServeMux).ServeHTTP
         0     0%   100%     7.82GB   100%  net/http.(*conn).serve
         0     0%   100%     7.82GB   100%  net/http.HandlerFunc.ServeHTTP
         0     0%   100%     7.82GB   100%  net/http.serverHandler.ServeHTTP
Wow, holy shit. Good luck in trying to find an affordable infrastructure to keep your API running this way.
Remember: even if you have a good computer to keep this huge amount of information, a production-grade infrastructure, even Kubernetes, won’t be able to keep up with this without destroying itself trying to arrange resources.
But let’s go back to our 3.5M population example. So it means that buffering structs and embedding slices/structs is taking a toll on our API, making it store 244MB. How can we fix that?
Use pointers within the slice
The first optimization is to use pointers instead of pure structs within a slice. So instead of storing, like, 30B, you’re storing just 8B.
Remember: given a pointer is 4/8 bytes, if a single struct, along with its fields, has a smaller size than that, it’s not even worth keeping them as pointers.
Let’s see how it goes, shall we?
    population := make([]*Person, 0)
    for i := 0; i < 3500000; i++ {
        population = append(population, &person)
    }
(pprof) top10
Showing nodes accounting for 19.70MB, 100% of 19.70MB total
Dropped 4 nodes (cum <= 0.10MB)
      flat  flat%   sum%        cum   cum%
   19.70MB   100%   100%    19.70MB   100%  main.handlePerson
         0     0%   100%    19.70MB   100%  net/http.(*ServeMux).ServeHTTP
         0     0%   100%    19.70MB   100%  net/http.(*conn).serve
         0     0%   100%    19.70MB   100%  net/http.HandlerFunc.ServeHTTP
         0     0%   100%    19.70MB   100%  net/http.serverHandler.ServeHTTP
Yup, that’s a HUGE improvement! From 244MB to 19MB in heap usage. Still, it’s not enough, how about making the embedded slices to store pointers as well?
type Person struct {
    // ...
    Parents  []*Person
}

func handlePerson(w http.ResponseWriter, req *http.Request) {
    person := Person{
        //...
        Parents:   []*Person{
            {
                Name:      "<Redacted>",
                LastName:  "Damázio",
                Age:       60,
                ID:        "f-off1",
            },
            {
                Name:      "<Redacted>",
                LastName:  "Damázio",
                Age:       63,
                ID:        "f-off3",
            },
        }
    }
    //...
}
(pprof) top10
Showing nodes accounting for 24.62MB, 100% of 24.63MB total
Dropped 4 nodes (cum <= 0.12MB)
      flat  flat%   sum%        cum   cum%
   24.62MB   100%   100%    24.62MB   100%  main.handlePerson
         0     0%   100%    24.62MB   100%  net/http.(*ServeMux).ServeHTTP
         0     0%   100%    24.62MB   100%  net/http.(*conn).serve
         0     0%   100%    24.62MB   100%  net/http.HandlerFunc.ServeHTTP
         0     0%   100%    24.62MB   100%  net/http.serverHandler.ServeHTTP
Well… not worth putting the Parents as a slice of pointers, because they
need to have their Parents assigned as well.
So a Person without Parents (that’s some kind of a tasteless joke, but
wasn’t intended) is lesser than 8 bytes, so Parents values may not be worth
putting as pointers.
But I still have one more thing under my sleeve.
Use channels instead of buffering with slices
Channels is a mechanism present in Go which you can pass data across different parts of the code (functions, goroutines, etc).
How’s that useful?
Well, let’s see how it goes.
The querying function cannot be inside that handle function, so let’s isolate that and use channels.
// Unidirectional channel (just read ops)
func queryPerson() <-chan *Person {
    // pretend this is a SQL fetching
    personChan := make(chan *Person)

    go func() {
        defer close(personChan)
        person := Person{
            Name:      "Carlos",
            LastName:  "Damázio",
            Age:       28,
            ID:        "f-off",
            Parents:   []Person{
                {
                    Name:      "<Redacted>",
                    LastName:  "Damázio",
                    Age:       60,
                    ID:        "f-off1",
                },
                {
                    Name:      "<Redacted>",
                    LastName:  "Damázio",
                    Age:       63,
                    ID:        "f-off3",
                },
            }
        }

        for i := 0; i < 3500000; i++ {
            personChan <- &person
        }
    }

    return personChan
}

func handlePerson(w http.ResponseWriter, req *http.Request) {
    personChan := queryPerson()

    for person := range personChan {
        // do something with the person
    }

    time.Sleep(5 * time.Second)
}
A little explanation before moving to our execution:
- We extracted the logic of our querying outside our handle;
- The query function will return a read channel;
- At the same time that our
handlePersonwill be reading the channel, we launched a goroutine to be passing the values to the channel we just returned from ourqueryPersonfunction; - Do NOT forget to close the channel once it’s done to avoid hanging the iterator.
So with that, we’re keeping only one Person in our memory at all times, which
results in the following:
(pprof) top10
Showing nodes accounting for 4.06kB, 100% of 4.06kB total
      flat  flat%   sum%        cum   cum%
    4.06kB   100%   100%     4.06kB   100%  regexp/syntax.parse
         0     0%   100%     4.06kB   100%  github.com/google/pprof/profile.init
         0     0%   100%     4.06kB   100%  regexp.Compile (inline)
         0     0%   100%     4.06kB   100%  regexp.MustCompile
         0     0%   100%     4.06kB   100%  regexp.compile
         0     0%   100%     4.06kB   100%  regexp/syntax.Parse (inline)
         0     0%   100%     4.06kB   100%  runtime.doInit
         0     0%   100%     4.06kB   100%  runtime.main
This is soooo useful when dealing with huge amount of data that you can’t possibly store in memory.
Parting words
So we learned a bit about memory and how to debug it in Go programming language.
I hope that I could show you a thing or two with this, and I’d like to encourage you to go even further on what I explained, and also cross-check any additional references.
Also take a moment to read the sources that I used for this post, as they contain a lot of valuable information and top-notch knowledge that may be useful to you as it was for me. And generally, these folks are smarter than I am.
Happy learning, and happy coding! =)
Sources
- W. R. Stevens and S. A. Rago, Advanced programming in the UNIX environment, Third Edition. in The Addison-Wesley professional computing series. Upper Saddle River, New Jersey: Addison-Wesley, 2013.
- R. Bryant and D. O’Hallaron, Computer Systems GE, 3rd ed. Melbourne: P. Ed Australia, 2015.
- R. H. Arpaci-Dusseau and A. C. Arpaci-Dusseau, Operating systems: three easy pieces. Erscheinungsort nicht ermittelbar: Arpaci-Dusseau Books, LLC, 2018.
- A Guide to the Go Garbage Collector
You can see this example in OS development tutorials when coding a bootloader. Generally, entry points are determined by the standard of the binary being produced, like the ELF (Executable and Linkable Format) from UNIX-like systems, where the entry point address is described at offset
0x18in the file header callede_entry. Read it 4/8 bytes, and you’ll know where your program must start. ↩︎Programming languages may or may not have different memory models, same with operating systems and CPU architectures. Some of them are designed inspired by another language/system. See below. ↩︎
Go’s memory model is low-key inspired in C++. See The Go Memory Model for more information. ↩︎